ESG Data, Further Reading
ESG DATA: ENVIRONMENT
- Environmental Friendliness Efficiency Indicators
- JEPIX
- Global Warming Preventive Measures
- Resource Saving and Recycling
- Saving Water
- Forest Resources
- Managing Chemical Substances
- Environmental Load Material Flow
- Environmental Accounting
- Sites with ISO 14001 Certification
- Yui-no-Mori: Wildlife Survey Results
About the Data
Reporting Period
Fiscal 2024 (January 1 to December 31, 2024)
Guidelines Used for Reference
Ministry of the Environment, Environmental Report Guidelines (2012 Edition)
Ministry of the Environment, Environmental Accounting Guidelines (2005 Edition)
Global Reporting Initiative (GRI), Sustainability Reporting Guidelines
Organizational Units Covered
Organizational Units Covered: KOKUYO Co., Ltd., and 30 consolidated subsidiaries
| Consolidated subsidiaries | Within Japan | Kaunet Co., Ltd., KOKUYO Marketing Co., Ltd., KOKUYO Supply Logistics Co., Ltd., KOKUYO Logitem Co., Ltd., KOKUYO Product Shiga Co., Ltd., KOKUYO MVP Co., Ltd., LmD International Co., Ltd., Actus Co., Ltd., KOKUYO Finance Co., Ltd, KOKUYO & Partners Co., Ltd., Origin Co., Ltd., ESTIC Co., Ltd. |
|---|---|---|
| Overseas | KOKUYO Vietnam Co., Ltd., KOKUYO Malaysia Sdn. Bhd., KOKUYO (Shanghai) Management Co., Ltd., KOKUYO Commerce (Shanghai) Co., Ltd., KOKUYO Furniture (China) Co., Ltd., KOKUYO Design Consultants (Shanghai) Co., Ltd., KOKUYO International Asia Co., Ltd., KOKUYO International (Malaysia) Sdn. Bhd., KOKUYO Vietnam Trading Co., Ltd., KOKUYO Camlin Ltd., KOKUYO Hong Kong Ltd., Global Known Ltd., Lamex China Investment Ltd., Lamex Trading Co. Ltd., Dongguan Lamex Furniture Co., Ltd., Lamex (S) Sales Pte. Ltd., KOKUYO-IK (Thailand) Co., Ltd., KOKUYO International (Thailand) |

Environmental Friendliness Efficiency Indicators
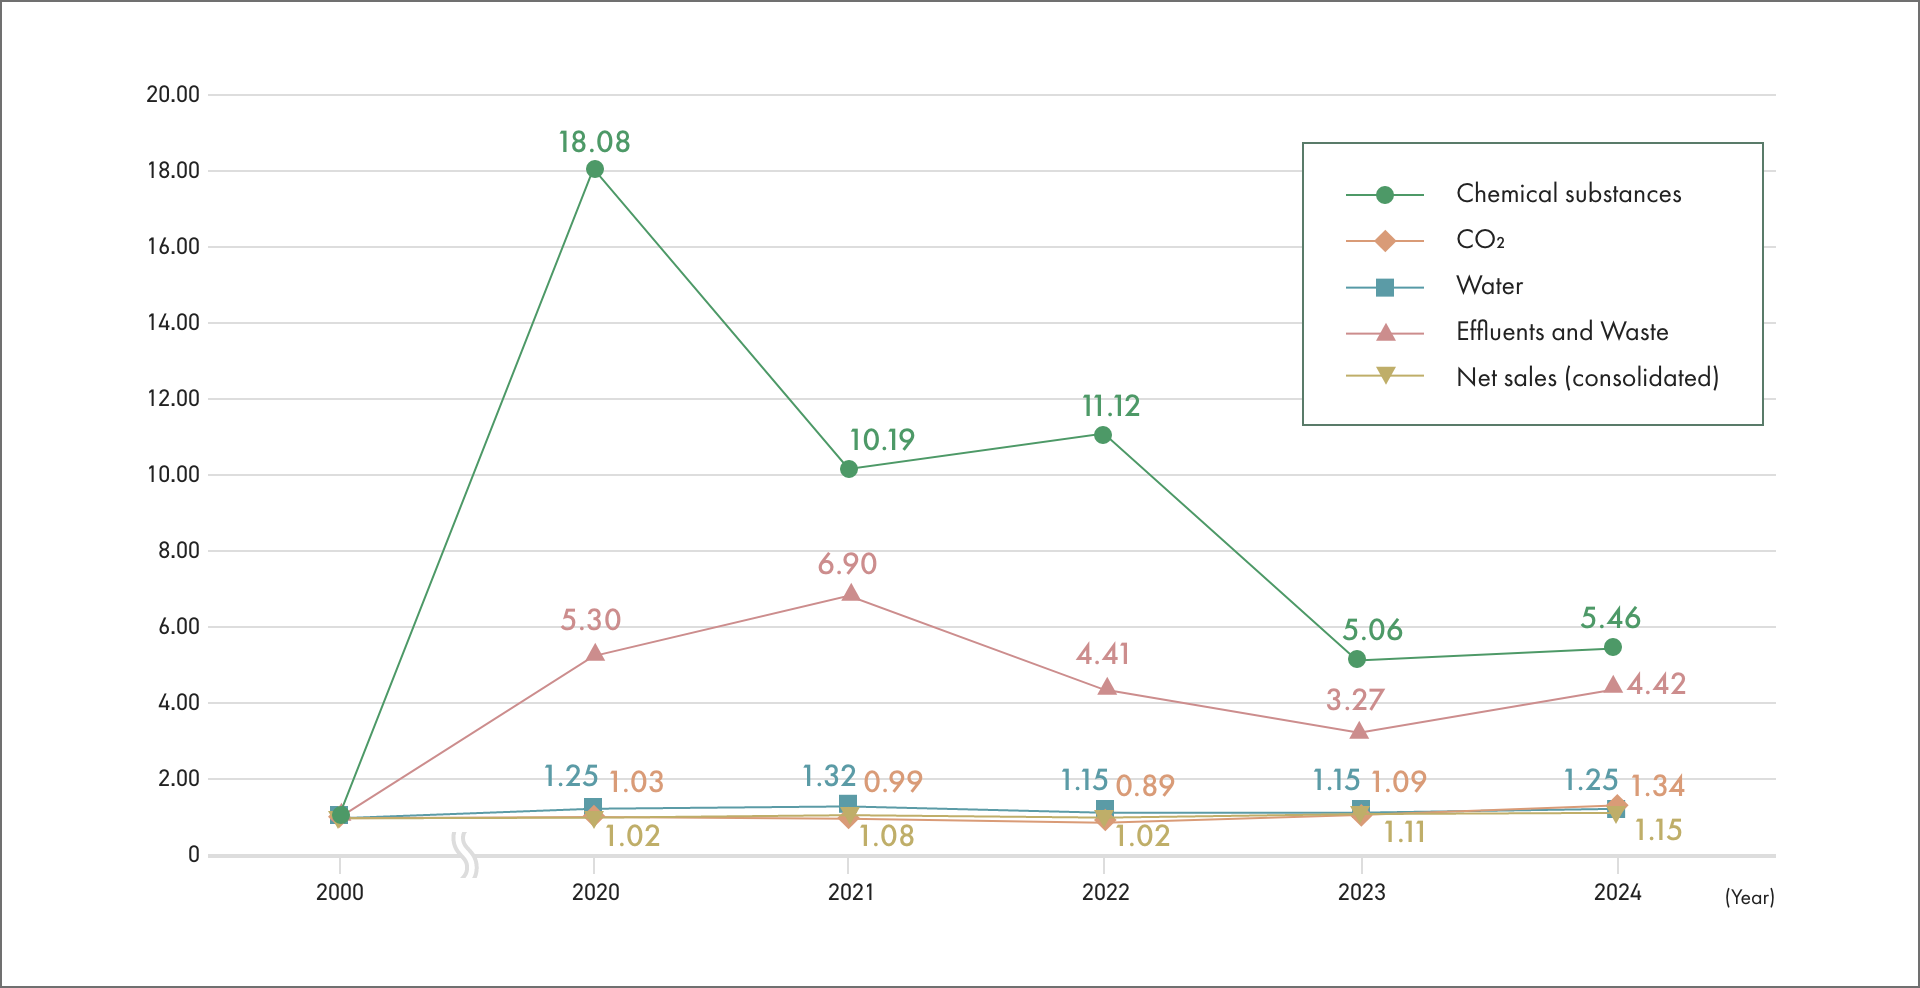
KOKUYO Group designates unique environmental friendliness efficiency indicators as indices to comprehensively evaluate financial performance and impact on the global environment. These indicators show the extent to which products and services are being offered to society with respect to specific environmental load and correspond to the following four items.
-
1.CO2emissions
-
2.Final waste disposal
-
3.Usage of chemical substances subject to PRTR regulations
-
4.Water usage
Environmental Friendliness Efficiency Indicators =
Fiscal year of interest (Sales / Environmental load data)Baseline fiscal year (Sales / Environmental load data)
Using fiscal 2000 as the baseline for each indicator, the progress status for each fiscal year can be determined.
Environmental Friendliness Efficiency Indicators
| 2000 | 2020 | 2021 | 2022 | 2023 | 2024 | |
|---|---|---|---|---|---|---|
| Chemical substances | 1.00 | 18.08 | 10.19 | 11.12 | 5.06 | 5.46 |
| CO2 | 1.00 | 1.03 | 0.99 | 0.89 | 1.09 | 1.34 |
| Water | 1.00 | 1.25 | 1.32 | 1.15 | 1.15 | 1.25 |
| Effluents and waste | 1.00 | 5.30 | 6.90 | 4.41 | 3.27 | 4.42 |
| Net sales (consolidated) | 1.00 | 1.02 | 1.08 | 1.02 | 1.11 | 1.15 |
-
*The chemical substances have been calculated according to the volume of chemical substances designated as class 1 under the PRTR Law handled by sites (in Japan) which are required to report data under the PRTR Law.
-
*The actual values from April to December 2023 have been given for the volume of chemical substances handled in 2023 in response to the revision to the PRTR Law.
-
*CO2(greenhouse gas emissions) has been calculated according to the adjusted emission factor for each power company.
JEPIX
The Japan Environmental Policy Priorities Index (JEPIX) is a method of quantifying the individual amount of different types of environmental loads, such as greenhouse gas emissions and air pollutants, as single indicators called Environmental Impact Points (EIP). The EIP is calculated by multiplying the environmental load of each environmentally harmful chemical by the integrated coefficient, which is calculated from the ratio between Japan’s environmental policy target and the actual amount of emissions (environmental friendliness factor), and then obtaining the sum total of them all.
Environmental impact point (EIP) =
Σ (environmental loads × environmental friendliness factors)
JEPIX
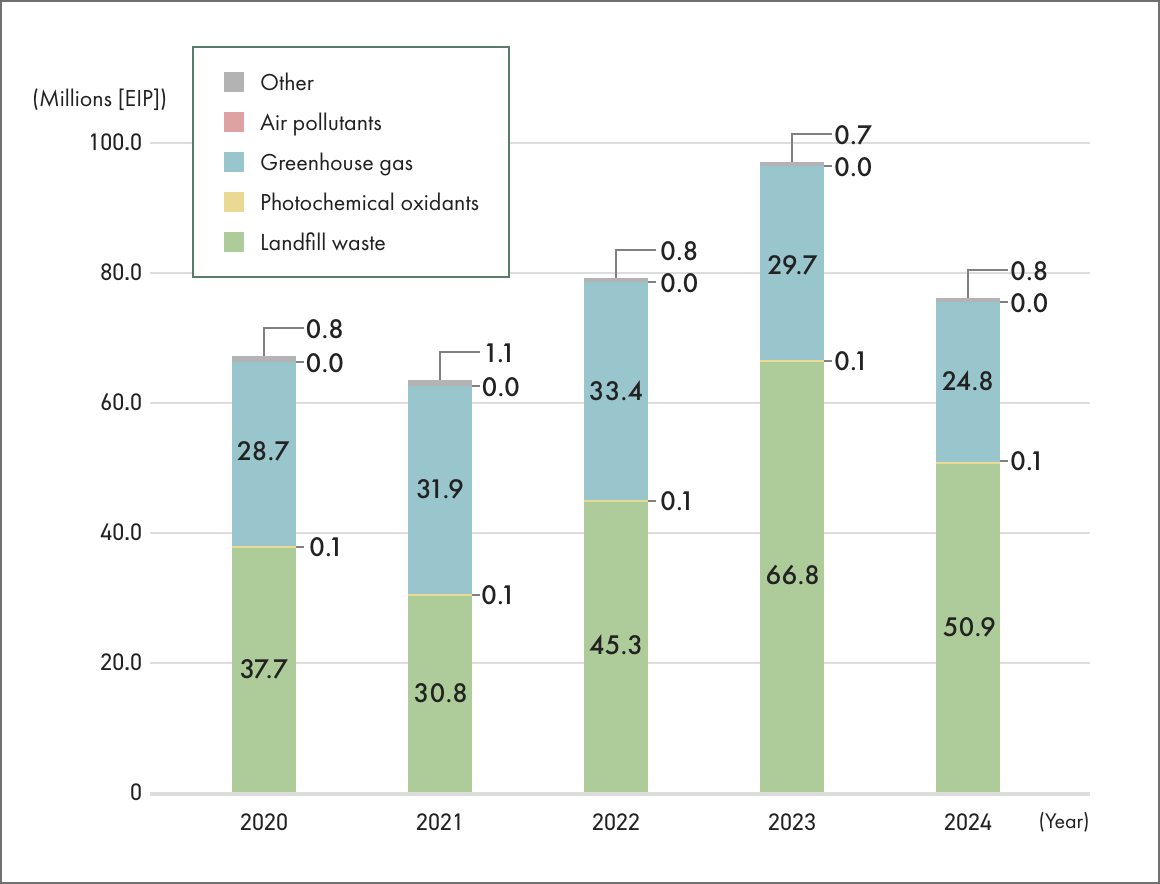
| Millions [EIP] | 2020 | 2021 | 2022 | 2023 | 2024 |
|---|---|---|---|---|---|
| Landfill waste | 37.7 | 30.8 | 45.3 | 66.8 | 50.9 |
| Photochemical oxidants | 0.1 | 0.1 | 0.1 | 0.1 | 0.1 |
| Greenhouse gas | 28.7 | 31.9 | 33.4 | 29.7 | 24.8 |
| Air pollutants | 0.0 | 0.0 | 0.0 | 0.0 | 0.0 |
| Other | 0.8 | 1.1 | 0.8 | 0.7 | 0.8 |
Emissions of soot and smoke (SOx and NOx ) designated by the Air Pollution Control Act
(Unit: Tons)
| 2020 | 2021 | 2022 | 2023 | 2024 | |
|---|---|---|---|---|---|
| SOx | - | - | - | - | - |
| NOx | 0.37 | 0.30 | 0.13 | 0.11 | 0.11 |
Global Warming Preventive Measures
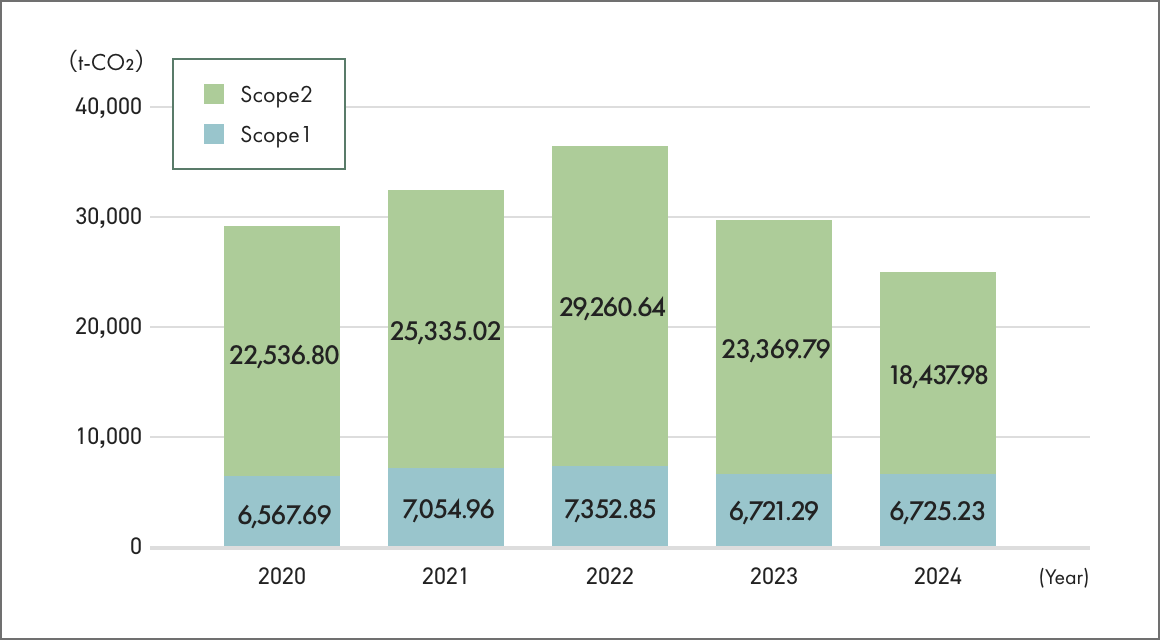
Scope 1 and 2 Emissions
(Unit:t-CO2)
| 2020 | 2021 | 2022 | 2023 | 2024 | |
|---|---|---|---|---|---|
| Scope1 | 6,567.69 | 7,054.96 | 7,352.85 | 6,721.29 | 6,725.23 |
| Scope2 | 22,536.80 | 25,335.02 | 29,260.64 | 23,369.79 | 18,437.98 |
| Total | 29,104.50 | 32,389.98 | 36,613.48 | 30,091.08 | 25,163.21 |
-
*Coverage (indicates the number of consolidated subsidiaries covered, besides KOKUYO, in the fiscal year of interest)
2020: KOKUYO + 20 consolidated subsidiaries
2021: KOKUYO + 20 consolidated subsidiaries
2022: KOKUYO + 26 consolidated subsidiaries
2023: KOKUYO + 26 consolidated subsidiaries
2024: KOKUYO + 30 consolidated subsidiaries -
*In line with the GHG Protocol’s Scope 2 Guidance, we take the market-based approach (which reflects supplier-specific emissions factors associated with our energy purchases).
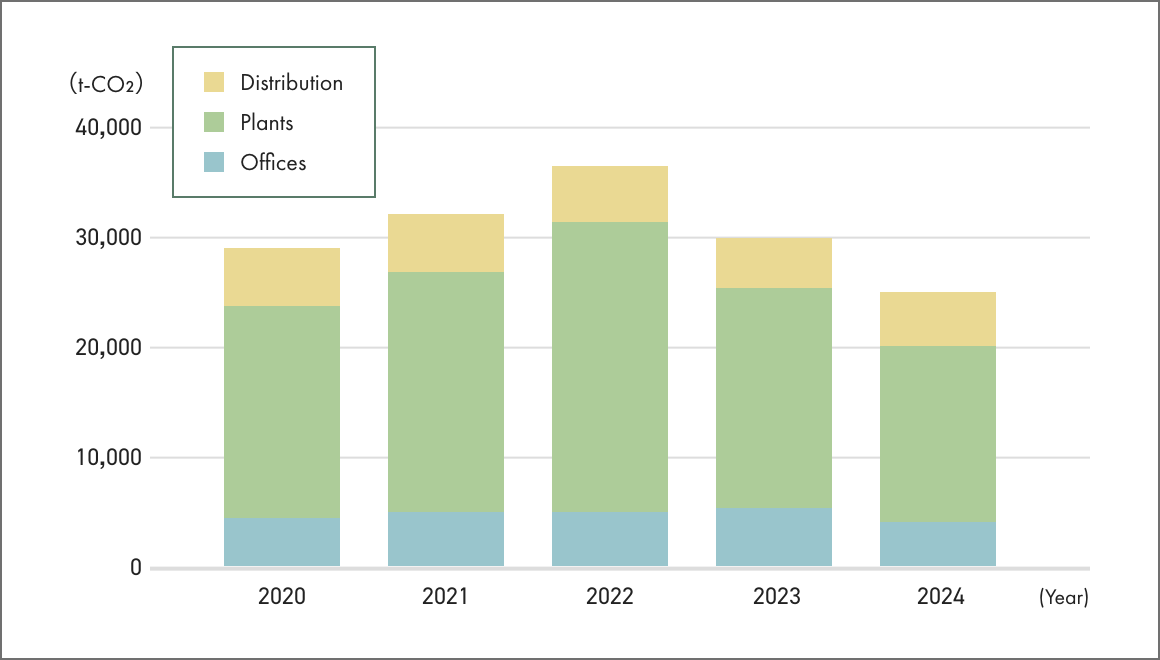
Emissions by Workplace
(Unit:t-CO2)
| Country | 2020 | 2021 | 2022 | 2023 | 2024 |
|---|---|---|---|---|---|
| Offices | 4,773.61 | 5,200.75 | 5,252.54 | 5,556.12 | 4,479.36 |
| Plants | 19,016.63 | 21,996.44 | 26,201.97 | 19,857.19 | 15,779.31 |
| Distribution | 5,314.26 | 5,192.79 | 5,158.98 | 4,677.77 | 4,904.54 |
| Total | 29,104.50 | 32,389.98 | 36,613.48 | 30,091.08 | 25,163.21 |
Emissions by Energy Source
(Unit:t-CO2)
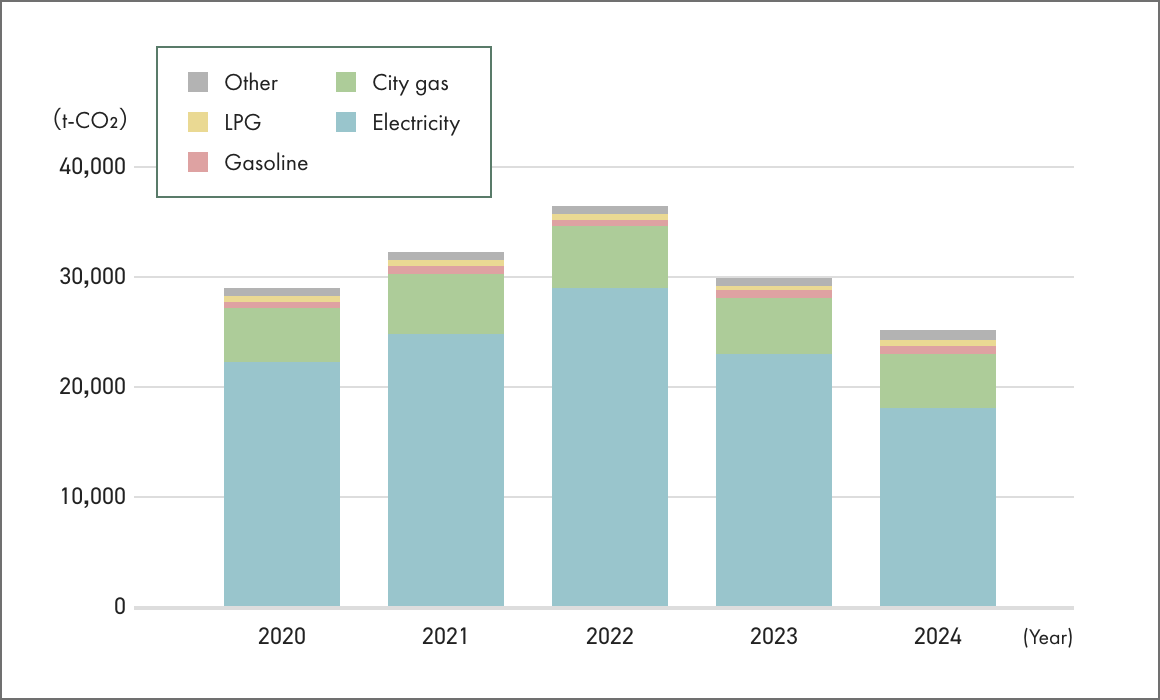
| Energy | 2020 | 2021 | 2022 | 2023 | 2024 |
|---|---|---|---|---|---|
| Electricity | 22,303.18 | 25,005.12 | 29,148.19 | 23,047.10 | 18,144.50 |
| City gas | 4,845.41 | 5,374.46 | 5,454.22 | 5,087.86 | 5,027.21 |
| Gasoline | 784.87 | 752.81 | 716.61 | 737.64 | 659.24 |
| LPG | 422.38 | 452.04 | 481.27 | 424.94 | 433.18 |
| Other | 748.66 | 805.55 | 813.20 | 793.55 | 899.09 |
| Total | 29,104.50 | 32,389.98 | 36,613.48 | 30,091.08 | 25,163.21 |
Water Usage by Country
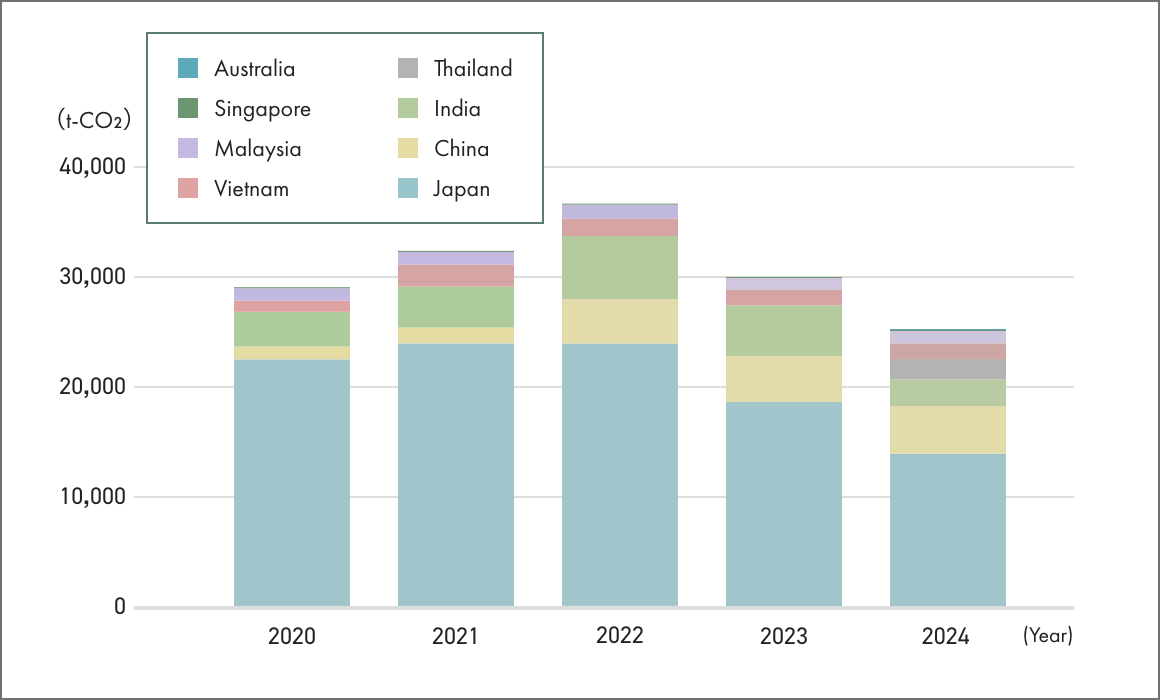
(Unit:t-CO2)
| Country | 2020 | 2021 | 2022 | 2023 | 2024 |
|---|---|---|---|---|---|
| Japan | 22,598.37 | 23,925.86 | 23,936.23 | 18,650.18 | 13,903.42 |
| China | 1,146.87 | 1,482.65 | 4,066.79 | 4,247.72 | 4,250.87 |
| India | 3,169.36 | 3,831.06 | 5,780.29 | 4,524.86 | 2,543.34 |
| Thailand | - | - | - | - | 1,792.27 |
| Vietnam | 969.42 | 1,921.41 | 1,568.28 | 1,518.02 | 1,465.23 |
| Malaysia | 1,215.27 | 1,224.10 | 1,255.05 | 1,140.62 | 1,194.90 |
| Singapore | 5.21 | 4.90 | 6.85 | 9.67 | 10.52 |
| Australia | - | - | - | - | 2.66 |
| Total | 29,104.50 | 32,389.98 | 36,613.48 | 30,091.08 | 25,163.21 |
-
*Coverage (indicates the number of consolidated subsidiaries covered, besides KOKUYO, in the fiscal year of interest)
2020: KOKUYO + 20 consolidated subsidiaries
2021: KOKUYO + 20 consolidated subsidiaries
2022: KOKUYO + 26 consolidated subsidiaries
2023: KOKUYO + 26 consolidated subsidiaries
2024: KOKUYO + 30 consolidated subsidiaries -
*In line with the GHG Protocol’s Scope 2 Guidance, we take the market-based approach (which reflects supplier-specific emissions factors associated with our energy purchases).
Scope 3 Emissions
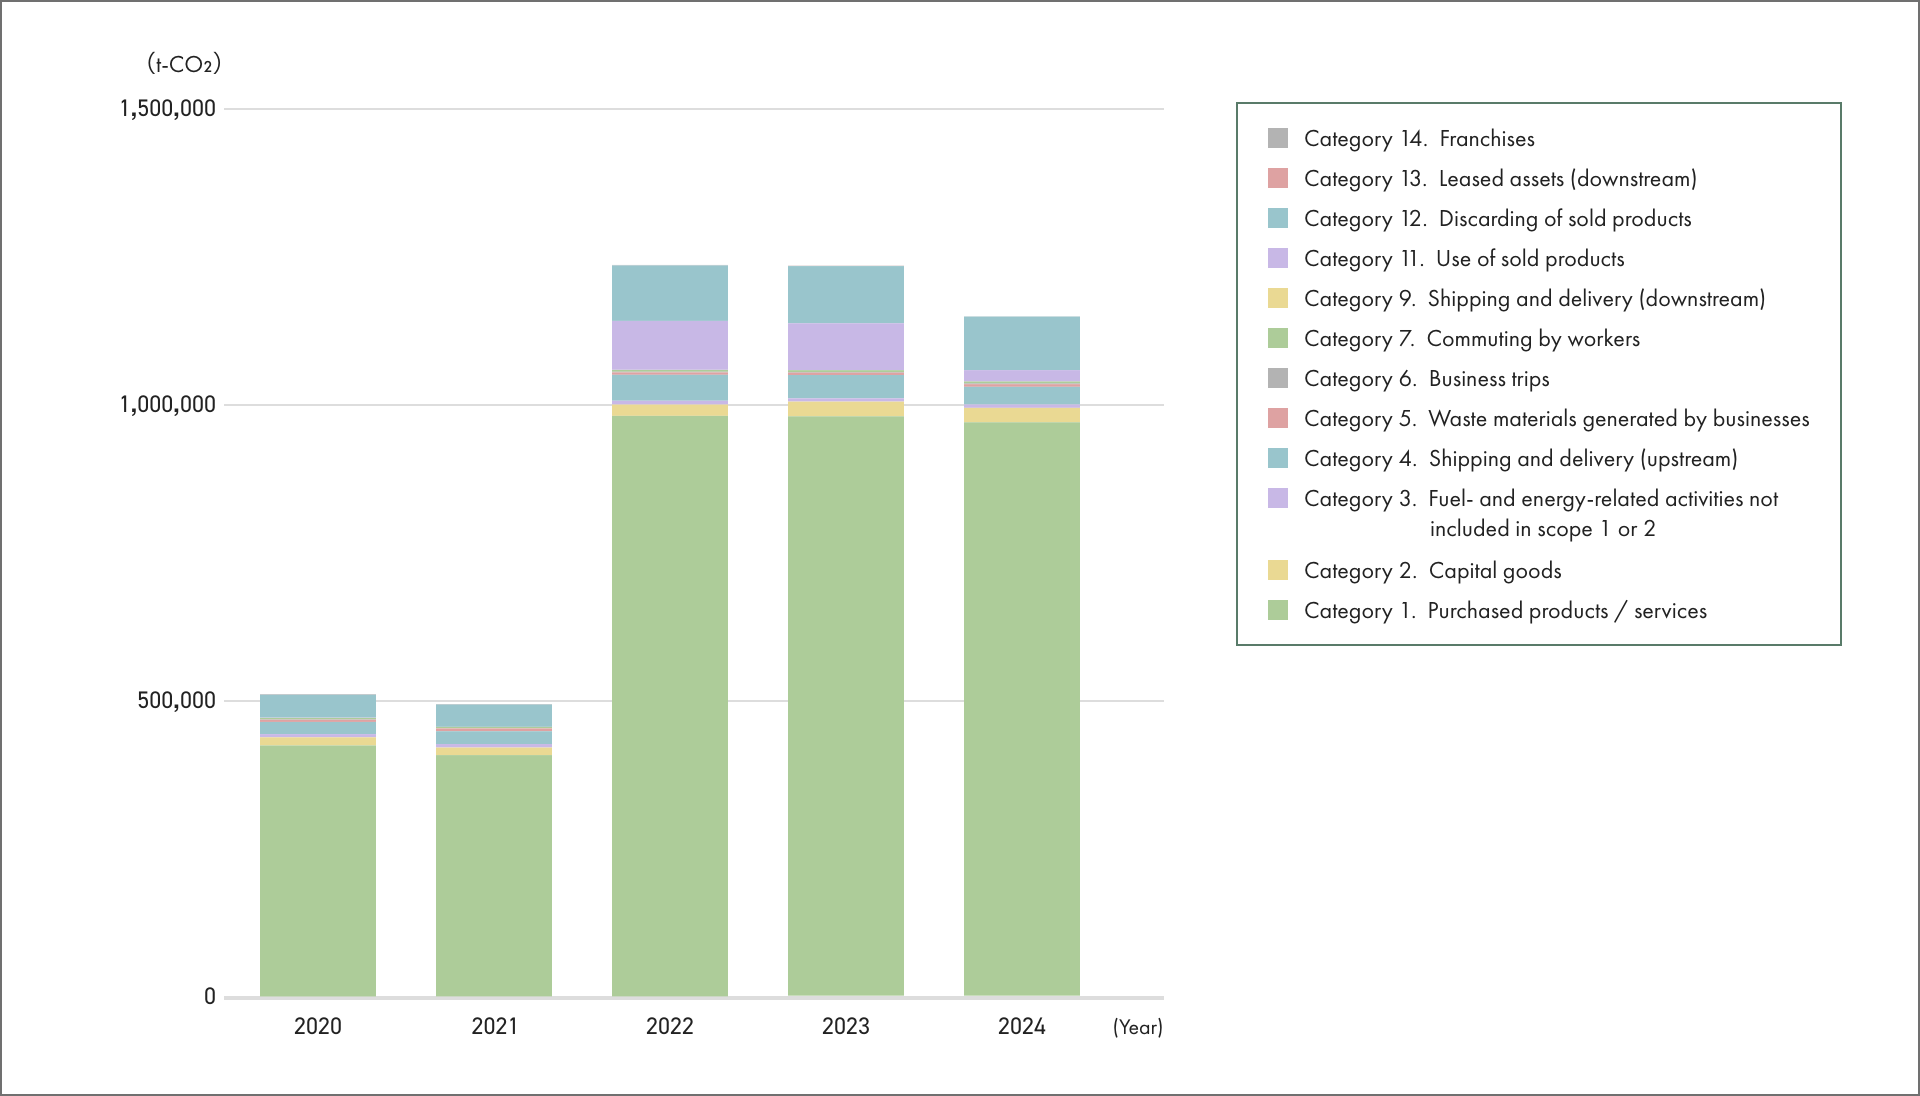
(Unit:t-CO2)
| Category | Applicable/ Not applicable |
Reason for Non-applicability | 2020 | 2021 | 2022 | 2023 | 2024 |
|---|---|---|---|---|---|---|---|
| Category 1. Purchased products / services | Applicable | - | 423,833.35 | 407,445.73 | 980,293.68 | 978,295.28 | 968,219.51 |
| Category 2. Capital goods | Applicable | - | 13,760.00 | 12,736.00 | 19,025.57 | 24,827.67 | 23,640.46 |
| Category 3. Fuel not included in Scope 1 or 2 and energy-related activities | Applicable | - | 5,449.11 | 5,938.27 | 6,491.14 | 5,516.78 | 5,684.69 |
| Category 4. Shipping and delivery (upstream) | Applicable | - | 20,489.93 | 21,625.26 | 43,798.15 | 39,421.81 | 29,841.34 |
| Category 5. Waste materials generated by businesses | Applicable | - | 3,571.39 | 4,037.40 | 4,002.51 | 3,883.85 | 4,490.72 |
| Category 6. Business trips | Applicable | - | 894.66 | 887.25 | 1,169.45 | 1,170.36 | 1,254.84 |
| Category 7. Commuting by workers | Applicable | - | 2,363.18 | 2,338.03 | 3,057.02 | 3,084.67 | 3,281.43 |
| Category 8. Leased assets (upstream) | Not applicable | Included in scopes 1 and 2 | - | - | - | - | - |
| Category 9. Shipping and delivery (downstream) | Applicable | - | 126.52 | 4.60 | 4.71 | ||
| Category 10. Processing of sold products | Not applicable | KOKUYO is a manufacturer of completed products and does not deal with intermediate products | - | - | - | - | - |
| Category 11. Use of sold products | Applicable | - | 503.59 | 111.69 | 82,627.99 | 79,249.71 | 19,163.35 |
| Category 12. Discarding of sold products | Applicable | - | 39,020.00 | 37,931.84 | 93,759.56 | 96,517.86 | 90,432.07 |
| Category 13. Leased assets (downstream) | Applicable | - | 837.56 | 670.61 | 302.90 | 284.33 | 58.66 |
| Category 14. Franchises | Applicable | - | - | - | 446.14 | 381.64 | 292.01 |
| Category 15. Investments | Not applicable | No investments | - | - | - | - | - |
| Total | 510,722.77 | 493,722.08 | 1,235,100.63 | 1,232,638.58 | 1,146,363.79 | ||
-
*Coverage (indicates the number of consolidated subsidiaries covered, besides KOKUYO, in the fiscal year of interest)
2020: KOKUYO
2021: KOKUYO
2022: KOKUYO + 26 consolidated subsidiaries
22023: KOKUYO + 26 consolidated subsidiaries
2024: KOKUYO + 30 consolidated subsidiaries
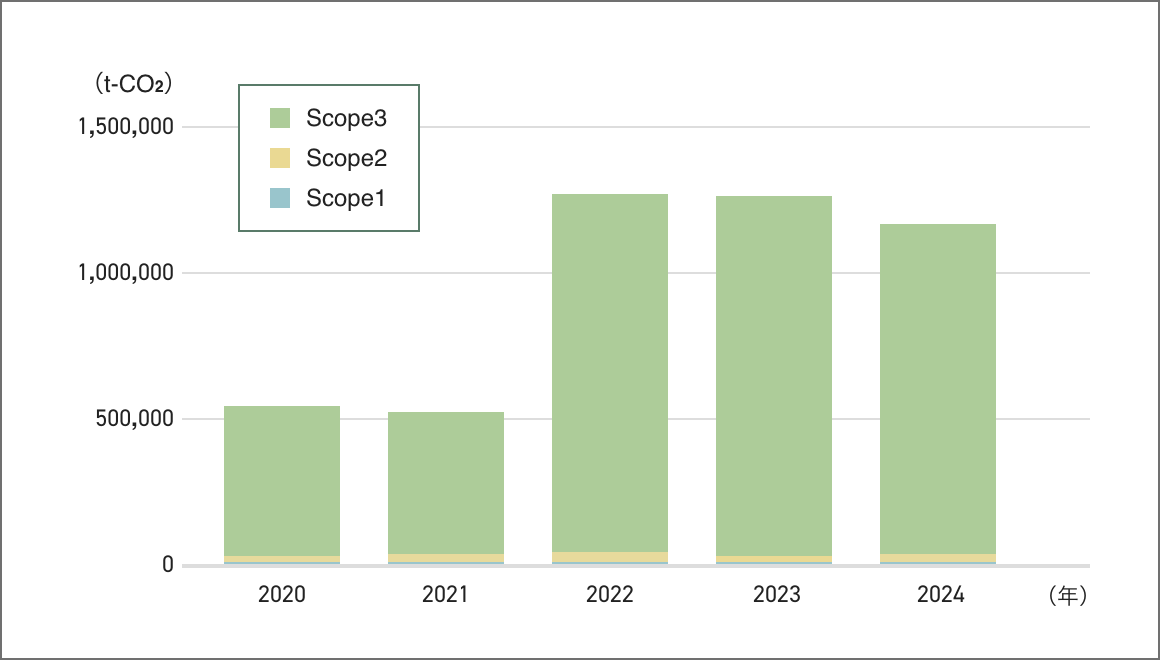
Scope 1, 2, and 3 Emissions
(Unit:t-CO2)
| 2020 | 2021 | 2022 | 2023 | 2024 | |
|---|---|---|---|---|---|
| Scope1 | 6,567.69 | 7,054.96 | 7,352.85 | 6,721.29 | 6,725.23 |
| Scope2 | 22,536.80 | 25,335.02 | 29,260.64 | 23,369.79 | 18,437.98 |
| Scope3 | 510,722.77 | 493,722.08 | 1,235,100.63 | 1,232,638.58 | 1,146,363.79 |
| Total | 539,827.27 | 526,112.06 | 1,271,714.11 | 1,262,729.66 | 1,171,526.99 |
-
*Coverage (indicates the number of consolidated subsidiaries covered, besides KOKUYO, in the fiscal year of interest)
2020: KOKUYO + 20 consolidated subsidiaries *Scope 3: KOKUYO
2021: KOKUYO + 20 consolidated subsidiaries *Scope 3: KOKUYO
2022: KOKUYO + 26 consolidated subsidiaries
2023: KOKUYO + 26 consolidated subsidiaries
2024: KOKUYO + 30 consolidated subsidiaries
Electric Power Consumption, Non-Fossil Fuel Weighting
(Unit: GWH)
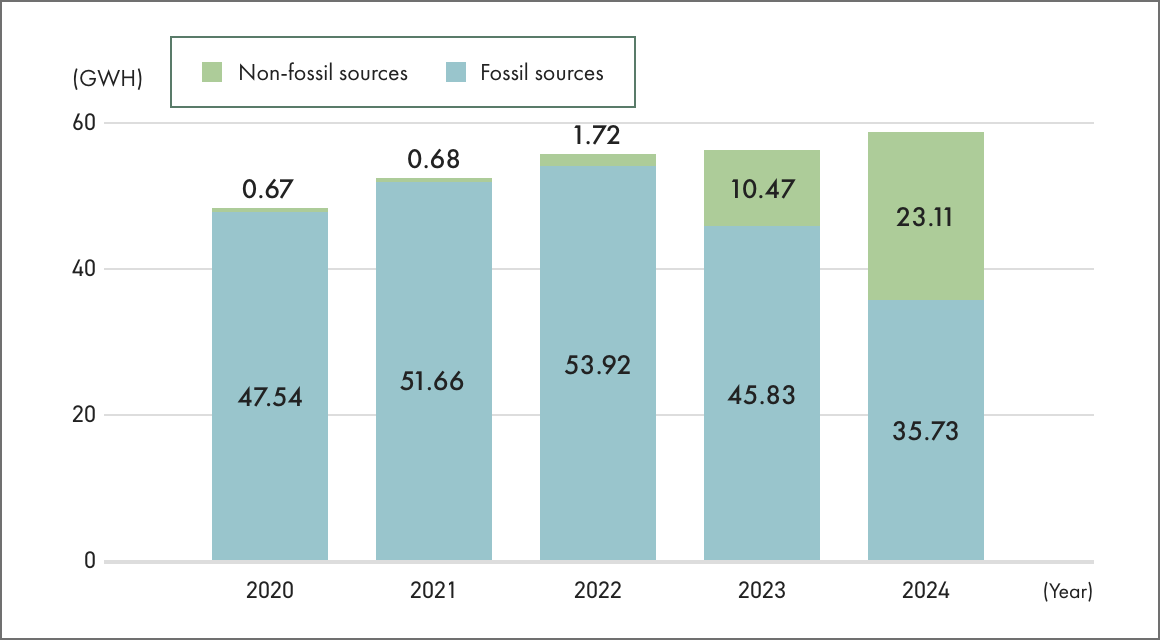
| Energy | 2020 | 2021 | 2022 | 2023 | 2024 |
|---|---|---|---|---|---|
| Fossil sources | 47.54 | 51.66 | 53.92 | 45.83 | 35.73 |
| Non-fossil sources | 0.67 | 0.68 | 1.72 | 10.47 | 23.11 |
| Energy total | 48.21 | 52.34 | 55.64 | 56.3 | 58.84 |
| % from non-fossil sources | 1.39% | 1.30% | 3.09% | 18.60% | 39.28% |
-
*Non-fossil sources include energy generated from solar energy systems on company sites, non-fossil options provided by electricity retailers, and feed-in tariff non-fossil certificates.
Intensity per Unit of Sales
Emissions Intensity per Unit of Sales
(Unit: t-CO2 / 100 million yen)
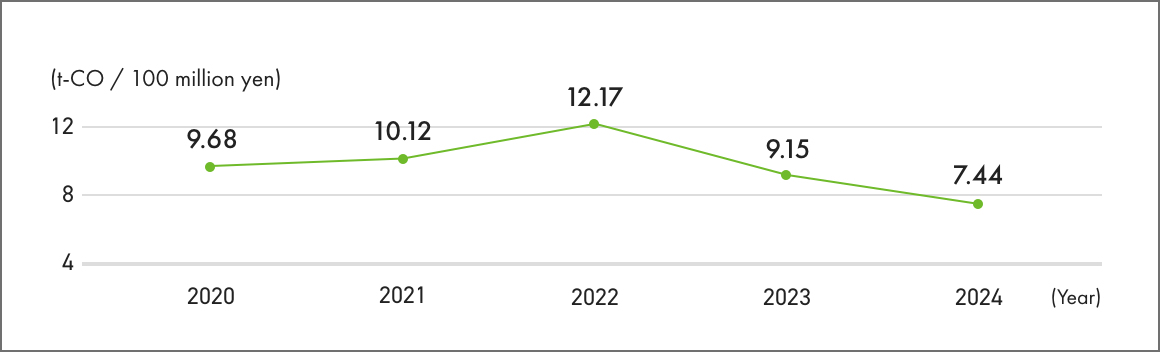
| 2020 | 2021 | 2022 | 2023 | 2024 | |
|---|---|---|---|---|---|
| Emissions Intensity per Unit of Sales | 9.68 | 10.12 | 12.17 | 9.15 | 7.44 |
Energy Intensity per Unit of Sales
(Unit: GJ / 100 million yen)
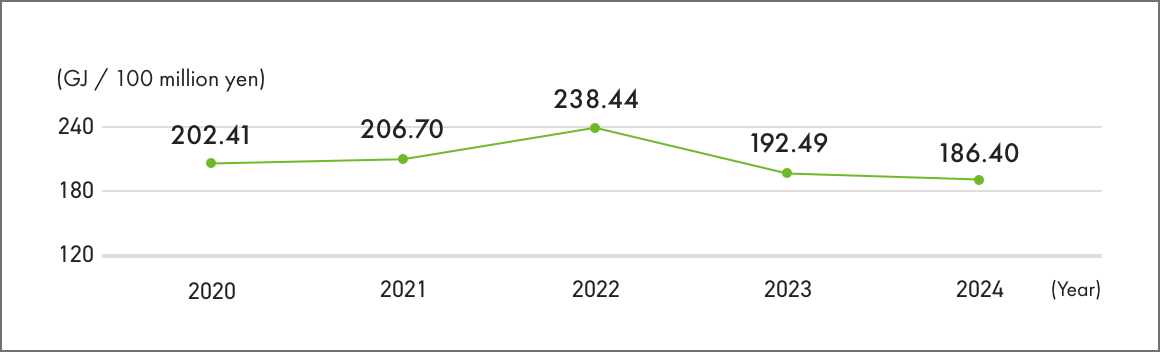
| 2020 | 2021 | 2022 | 2023 | 2024 | |
|---|---|---|---|---|---|
| Energy Intensity per Unit of Sales | 202.41 | 206.70 | 238.44 | 192.49 | 186.40 |
-
*Coverage (indicates the number of consolidated subsidiaries covered, besides KOKUYO, in the fiscal year of interest)
2020: KOKUYO + 20 consolidated subsidiaries
2021: KOKUYO + 20 consolidated subsidiaries
2022: KOKUYO + 26 consolidated subsidiaries
2023: KOKUYO + 26 consolidated subsidiaries
2024: KOKUYO + 30 consolidated subsidiaries
Resource Saving and Recycling
Total waste volume
Waste Materials: Recycling and Final Disposal Amounts
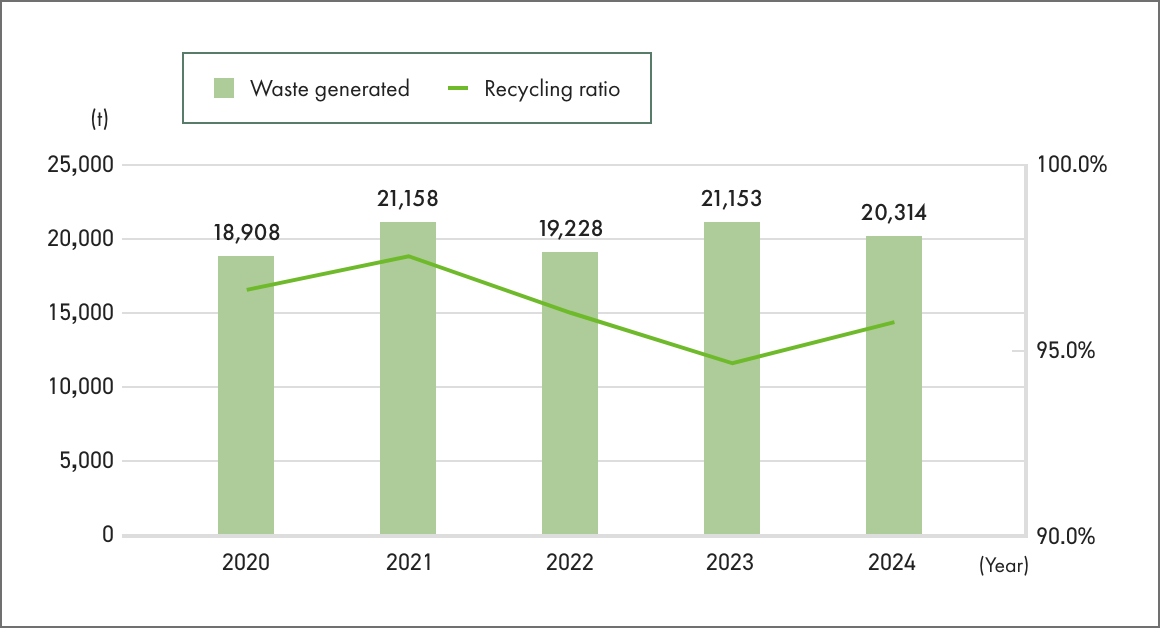
| Waste generated | Volume of waste recycled | Recycling ratio | |
|---|---|---|---|
| 2020 | 18,908 | 18,265 | 96.6% |
| 2021 | 21,158 | 20,632 | 97.5% |
| 2022 | 19,228 | 18,455 | 96.0% |
| 2023 | 21,153 | 20,014 | 94.6% |
| 2024 | 20,314 | 19,447 | 95.7% |
Emissions by Workplace (2024)
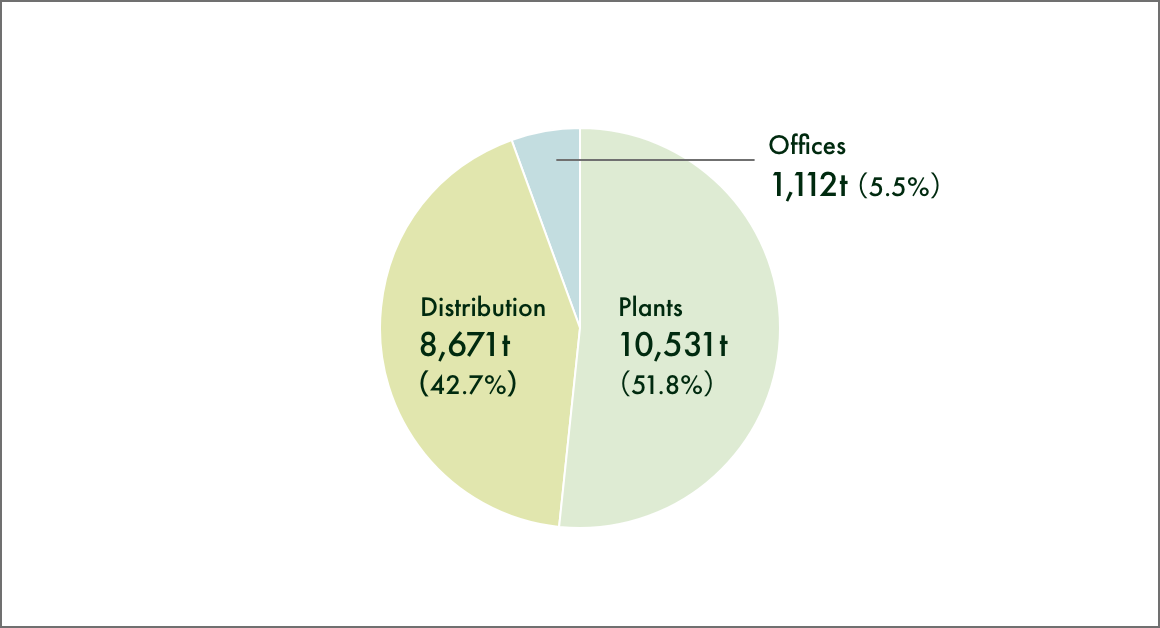
| Waste generated | % of total | |
|---|---|---|
| Plants | 10,531 | 51.8% |
| Distribution | 8,671 | 42.7% |
| Offices | 1,112 | 5.5% |
| Total | 20,314 | 100.0% |
Waste volume by waste type (2024) (recycling rate in brackets)
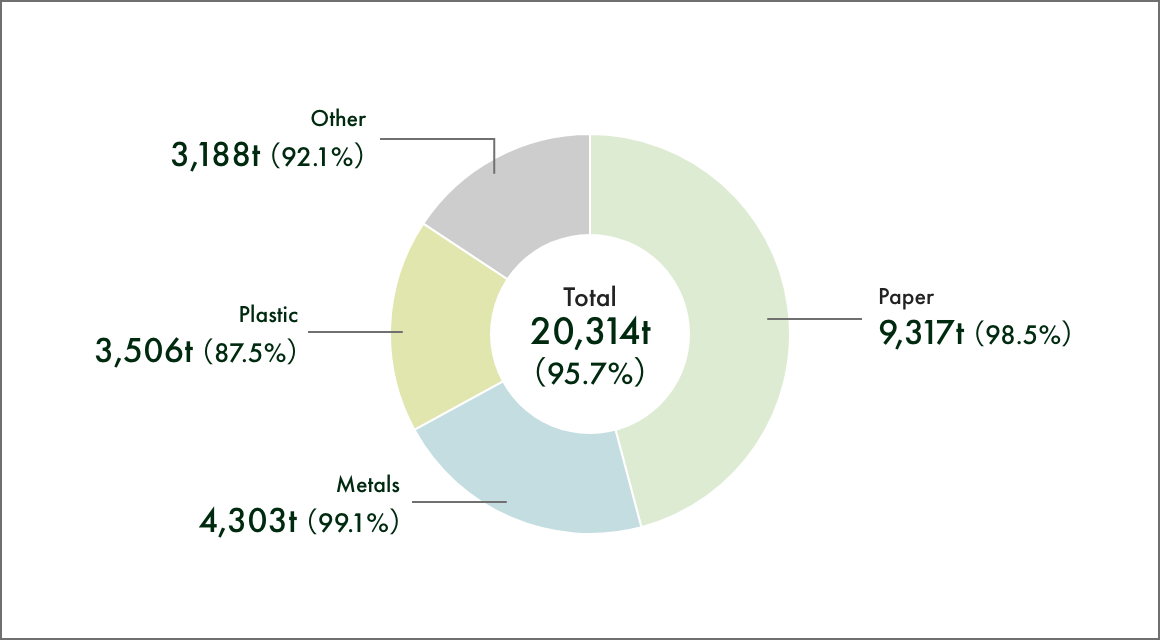
| Waste generated | Volume of waste recycled | Recycling ratio | |
|---|---|---|---|
| Paper | 9,317 | 9,181 | 98.5% |
| Metals | 4,303 | 4,265 | 99.1% |
| Plastic | 3,506 | 3,066 | 87.5% |
| Other | 3,188 | 2,935 | 92.1% |
| Total | 20,314 | 19,447 | 95.7% |
Waste volume by country (2024)
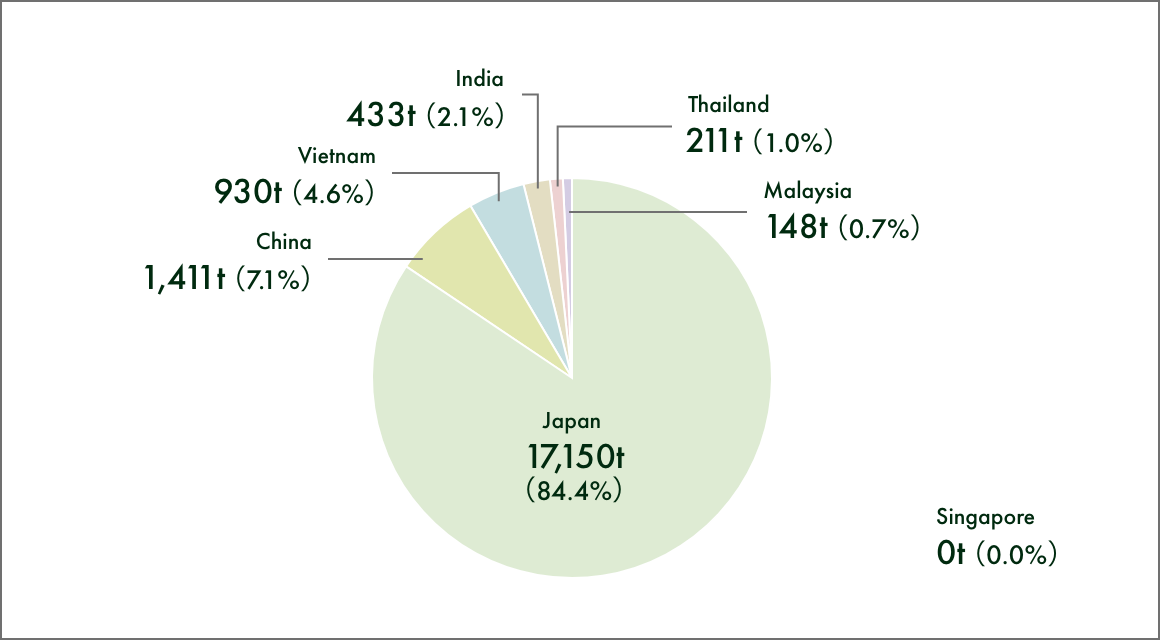
| Waste generated | % of total | |
|---|---|---|
| Japan | 17,150 | 84.4% |
| China | 1,441 | 7.1% |
| Vietnam | 930 | 4.6% |
| India | 433 | 2.1% |
| Thailand | 211 | 1.0% |
| Malaysia | 148 | 0.7% |
| Singapore | 0 | 0.0% |
| Total | 20,314 | 100.0% |
Hazardous waste
Hazardous Waste Generation
(Unit: t)
| 2022 | 2023 | 2024 | |
|---|---|---|---|
| Waste generated | 56 | 73 | 97 |
-
*KOKUYO Group defines and manages specially controlled industrial waste (as defined in Act on Waste Management and Public Cleansing) as hazardous waste.
Plastic waste
Plastic waste tonnage among industrial waste in Japan
(Unit: t)
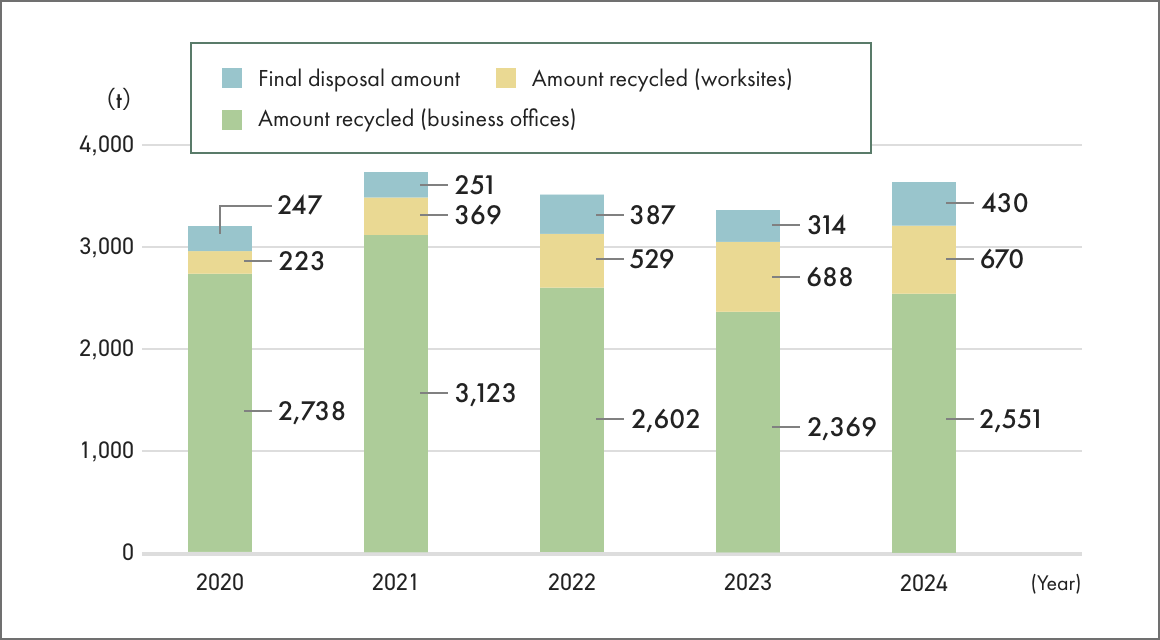
| Year | Amount recycled (business offices) | Amount recycled (worksites) | Final disposal amount | Total waste generated | Volume of waste recycled | Recycling ratio |
|---|---|---|---|---|---|---|
| 2020 | 2,738 | 223 | 247 | 3,208 | 2,961 | 92.3% |
| 2021 | 3,123 | 369 | 251 | 3,743 | 3,491 | 93.3% |
| 2022 | 2,602 | 529 | 387 | 3,519 | 3,132 | 89.0% |
| 2023 | 2,369 | 688 | 314 | 3,372 | 3,058 | 90.7% |
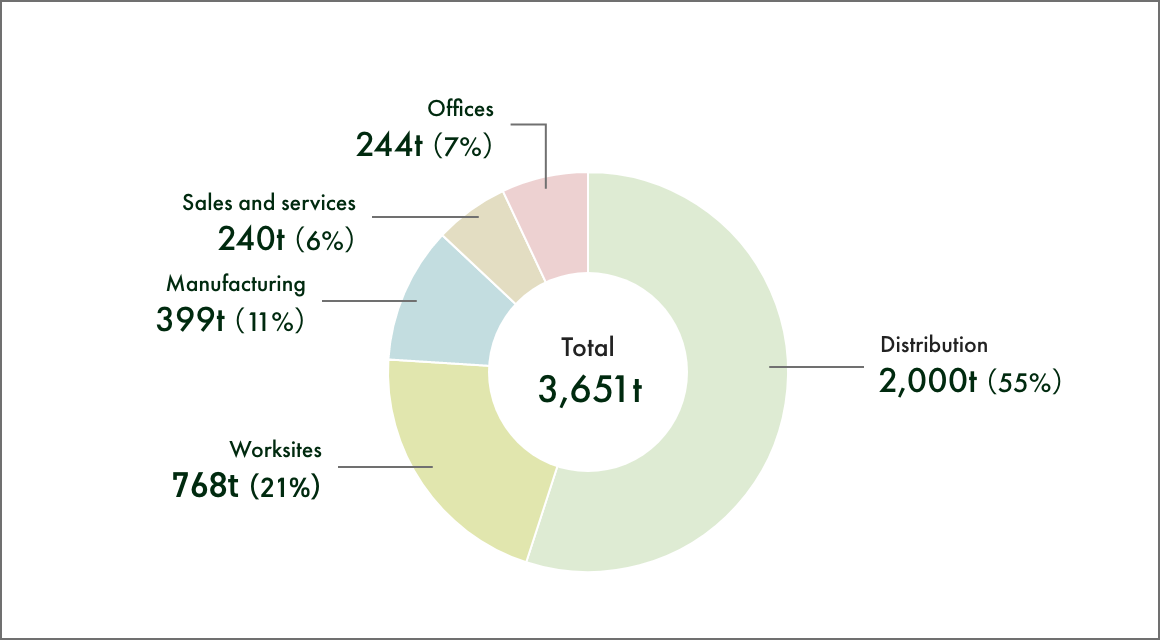
| 2024 | 2,551 | 670 | 430 | 3,651 | 3,221 | 88.2% |
-
*The above table categorizes industrial plastic waste in Japan in accordance with the Act on Promotion of Resource Circulation for Plastics.
Plastic waste tonnage by business category (2024)
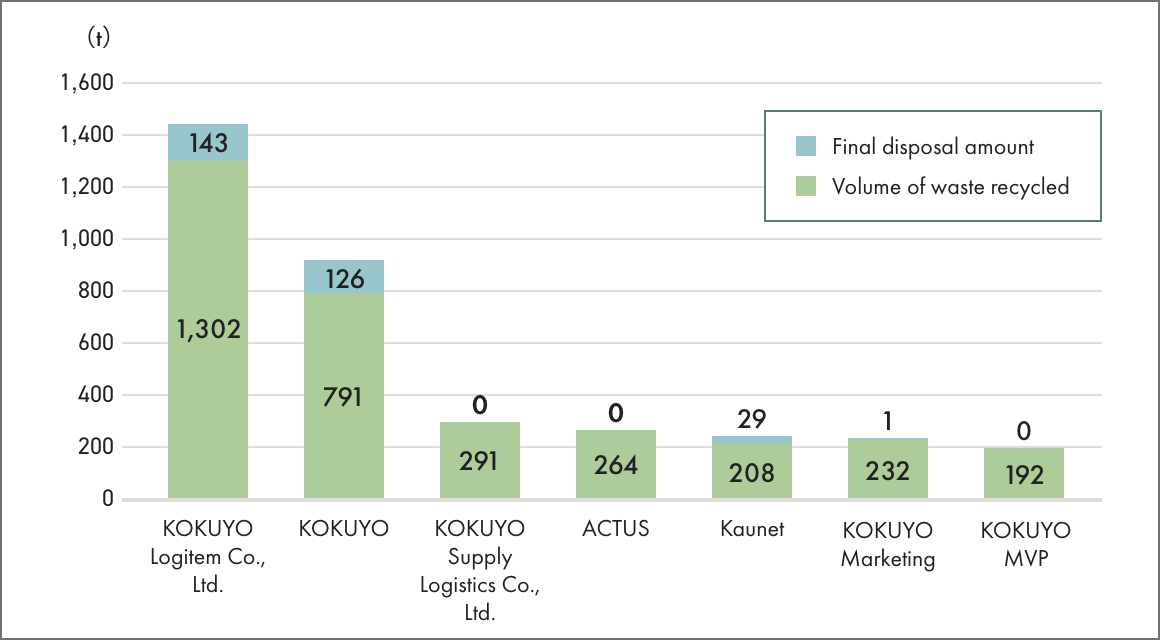
Plastic waste tonnage by group company (2024)
-
*Under the Act on Promotion of Resource Circulation for Plastics, a company is classified as a large quantity generator if it generated at least 250 tons of plastic waste in the previous year.
Saving Water
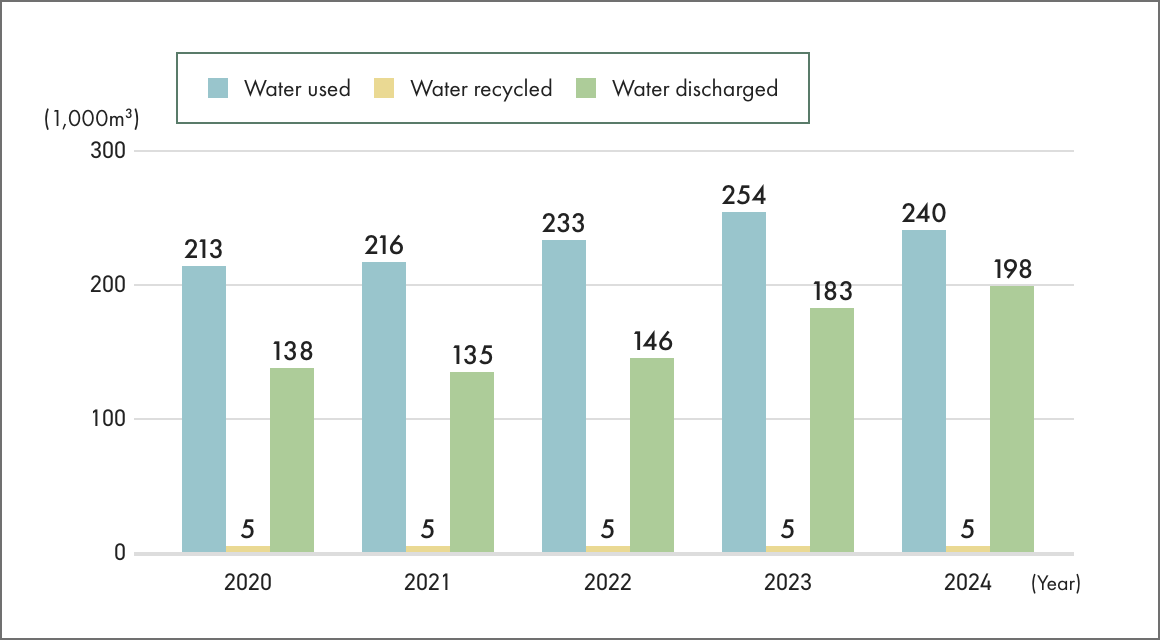
Water used, water recycled, water discharged
(Unit: 1,000m3)
| Water usage | Water recycled | Water discharged | |
|---|---|---|---|
| 2020 | 213 | 5 | 138 |
| 2021 | 216 | 5 | 135 |
| 2022 | 233 | 5 | 146 |
| 2023 | 254 | 5 | 183 |
| 2024 | 240 | 5 | 198 |
-
*Water recycled: Water recycled in plants
-
*Water discharged: Wastewater discharged into public water bodies or sewers
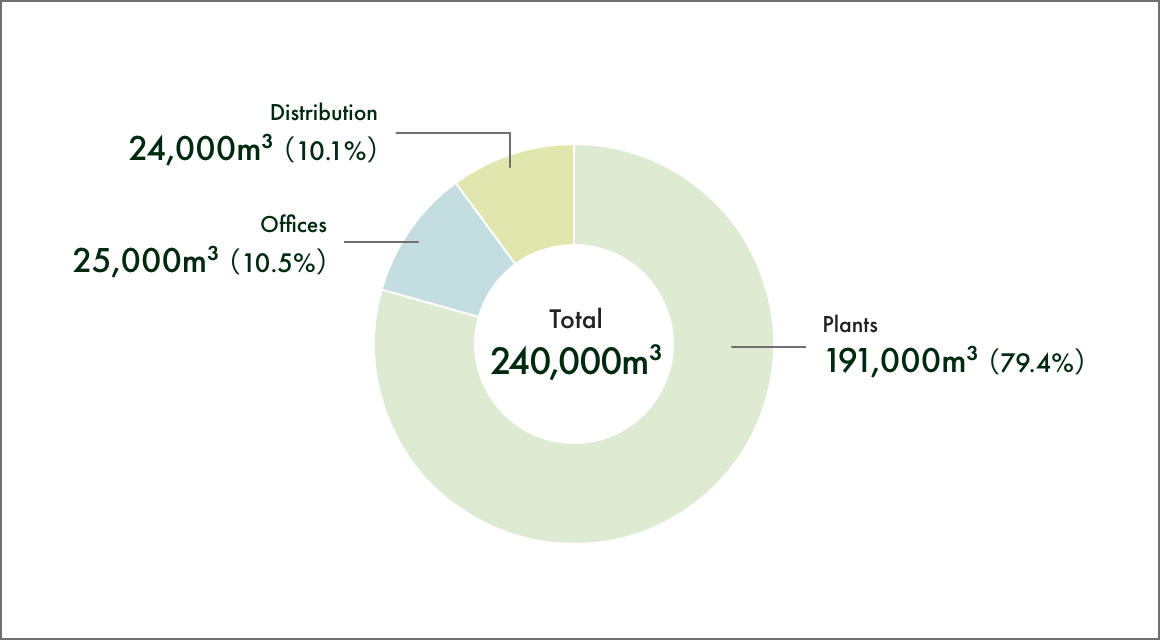
Water usage by location (2024)
| Water usage | % of total | |
|---|---|---|
| Plants | 191 | 79.4% |
| Offices | 25 | 10.5% |
| Distribution | 24 | 10.1% |
| Total | 240 | 100.0% |
Water usage by country (2024)
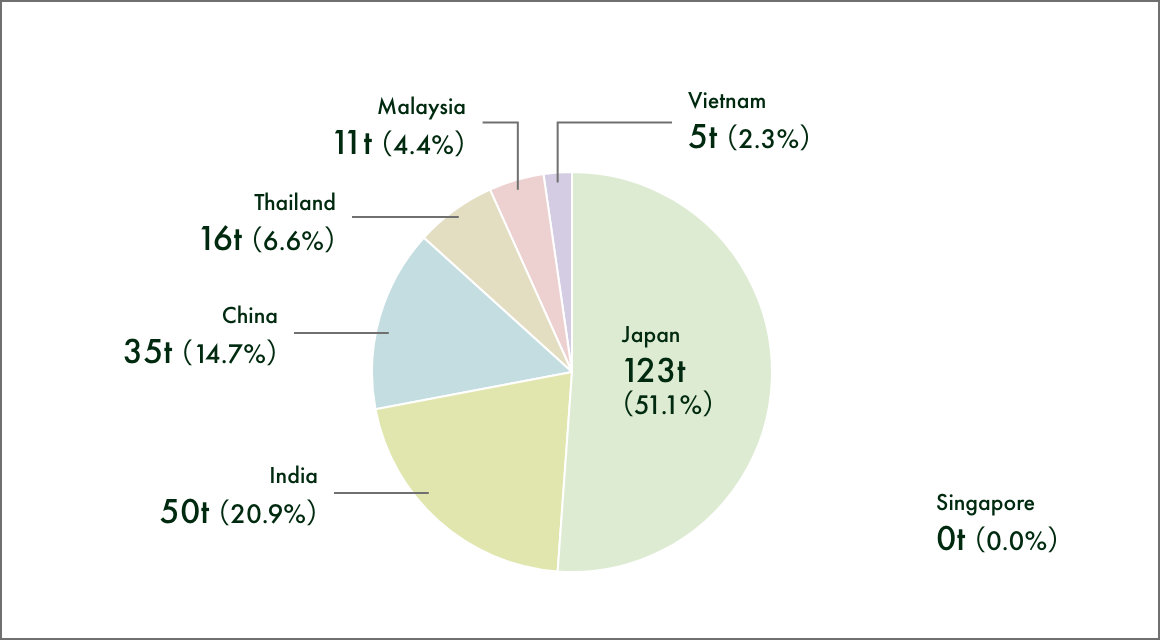
| Water usage | Water usage composition ratio | |
|---|---|---|
| Japan | 123 | 51.1% |
| India | 50 | 20.9% |
| China | 35 | 14.7% |
| Thailand | 16 | 6.6% |
| Malaysia | 11 | 4.4% |
| Vietnam | 5 | 2.3% |
| Singapore | 0 | 0.0% |
| Total | 240 | 100.0% |
Water usage across KOKUYO Group and water usage in production sites located in water-stressed areas (2024)
| Group total | Thailand | China | |||
|---|---|---|---|---|---|
| KOKUYO-IK (Thailand) Co., Ltd. : Thailand plant |
KOKUYO Commerce (Shanghai) Co., Ltd. : Shanghai plant |
||||
| Inputs | Water withdrawal | 240 | 16 | 1 | |
| Outputs | Water discharged | 198 | 13 | 1 | |
| Public water drainage | 39 | - | - | ||
| Drainage to the sewer system | 159 | 13 | 1 | ||
Forest Resources
Timber Use in Furniture Products (2024)
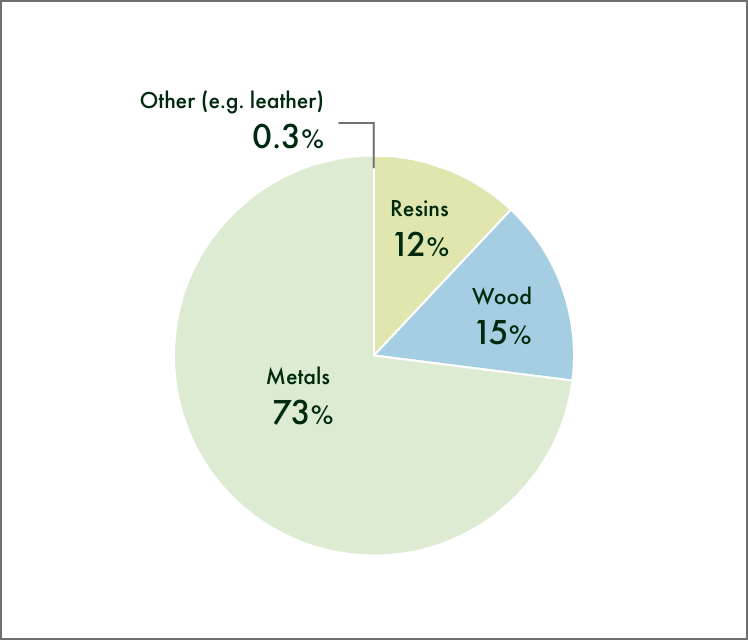
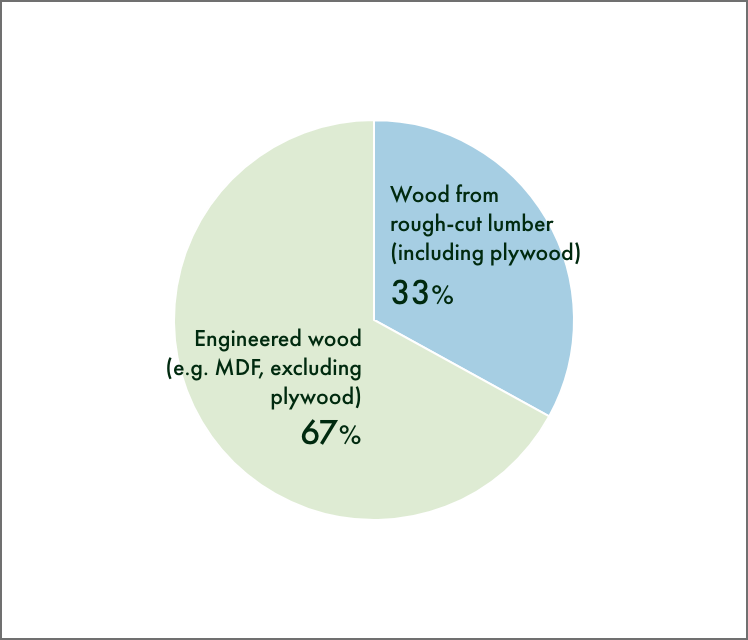
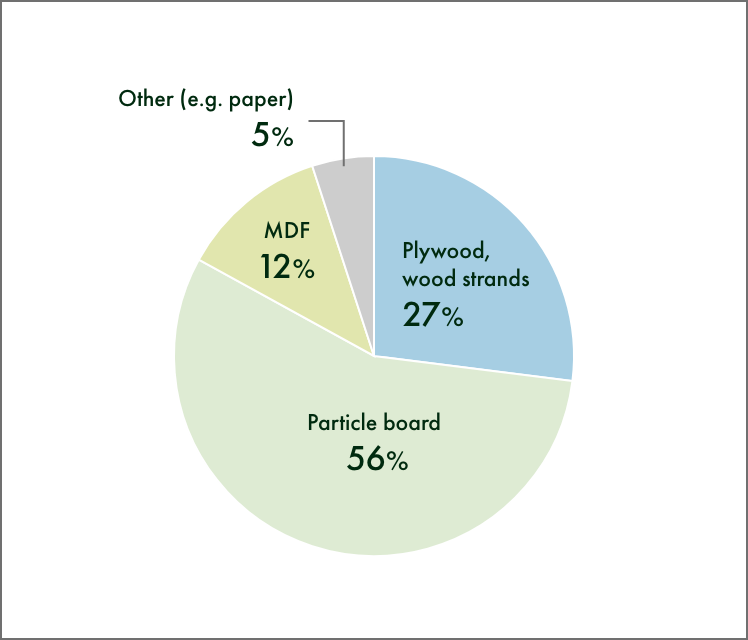
Survey of Timber Use in Furniture Products
| Tree species | Condition | Volume used (t) | Country or region of origin |
|---|---|---|---|
| Ash | Wood strands | 21 | USA |
| Walnut tree | Solid wood | 1 | USA |
| Canadian oak | Wood strands | 101 | Canada |
| Kapur | Plywood | 17 | Indonesia |
| Castor aralia | Wood strands | 2 | Japan |
| Japanese oak | Veneer | 4 | Japan |
| Nyatoh species | Solid wood | 7 | Indonesia |
| Pine | Veneer | 39 | Chile |
| Falcata | Plywood | 71 | Indonesia |
| Beech | Wood strands | 209 | Croatia, Germany |
| Poplar | Plywood, Wood strands | 185 | China, USA |
| White oak | Veneer | 6 | USA |
| Merkus pine | Glued laminated timber | 1 | Indonesia |
| Eucalyptus | Plywood | 36 | China |
| Rubberwood | Plywood, wood strands | 803 | Vietnam, Malaysia |
| Lauan | Plywood | 687 | Indonesia |
| Red oak | Solid wood | 12 | USA |
| Total | 2202 | ||
-
*The data in the above table has been aggregated from the figures provided by each supplier. The data covers only wood from rough-cut lumber and plywood (it excludes MDF, for example).
-
*The table shows only wood species for which we could identify the country or region.
Managing chemical substances
Chemical Substances Subject to PRTR
| PRTR Management No. | Chemical name | Vol. handled kg |
Vol. released, transferred | Vol. treated kg |
Vol. consumed kg |
||||
|---|---|---|---|---|---|---|---|---|---|
| Vol. Released into Air kg |
Vol. Released into Public Bodies of Water kg |
Vol. Released into Sewers kg |
Vol. Sent to Landfill kg |
Subtotal kg |
|||||
| 1 | Water-soluble zinc compounds | 190.2 | 0.0 | 0.0 | 0.0 | 0.0 | 0.0 | 190.2 | 0.0 |
| 20 | 2-aminoethanol | 309.8 | 0.0 | 0.0 | 0.0 | 0.0 | 0.0 | 309.8 | 0.0 |
| 53 | Ethylbenzene | 9.1 | 9.0 | 0.0 | 0.0 | 0.1 | 9.1 | 0.0 | 0.0 |
| 80 | Xylene | 10.5 | 10.4 | 0.0 | 0.0 | 0.1 | 10.5 | 0.0 | 0.0 |
| 82 | Silver and its water-soluble compounds | 0.5 | 0.0 | 0.0 | 0.0 | 0.0 | 0.0 | 0.5 | 0.0 |
| 83 | Cumene | 3.5 | 3.4 | 0.0 | 0.0 | 0.0 | 3.5 | 0.0 | 0.0 |
| 87 | Chromium and chromium(III) compounds | 0.3 | 0.0 | 0.0 | 0.0 | 0.0 | 0.0 | 0.0 | 0.3 |
| 125 | Chlorobenzene | 3.0 | 3.0 | 0.0 | 0.0 | 0.0 | 3.0 | 0.0 | 0.0 |
| 127 | Chloroform | 2.9 | 2.9 | 0.0 | 0.0 | 0.0 | 2.9 | 0.0 | 0.0 |
| 298 | Tolylene diisocyanate | 0.7 | 0.7 | 0.0 | 0.0 | 0.0 | 0.7 | 0.0 | 0.0 |
| 300 | Toluene | 45.2 | 44.8 | 0.0 | 0.0 | 0.3 | 45.2 | 0.0 | 0.0 |
| 302 | Naphthalene | 11.8 | 11.7 | 0.0 | 0.0 | 0.1 | 11.8 | 0.0 | 0.0 |
| 306 | Hexamethylene diacrylate | 0.0 | 0.0 | 0.0 | 0.0 | 0.0 | 0.0 | 0.0 | 0.0 |
| 309 | Nickel compounds | 9.8 | 0.0 | 0.0 | 0.0 | 0.0 | 0.0 | 9.8 | 0.0 |
| 321 | Vanadium compounds | 24.0 | 0.0 | 0.0 | 0.0 | 0.0 | 0.0 | 24.0 | 0.0 |
| 392 | N-hexane | 1,715.4 | 1,715.4 | 0.0 | 0.0 | 0.0 | 1,715.4 | 0.0 | 0.0 |
| 407 | Poly(oxyethylene) alkyl ether | 500.5 | 0.0 | 0.0 | 0.0 | 73.9 | 73.9 | 245.0 | 181.6 |
| 410 | Poly(oxyethylene) nonylphenyl ether | 5.4 | 0.0 | 0.0 | 0.0 | 0.2 | 0.2 | 0.0 | 5.2 |
| 412 | Manganese and its compounds | 46.6 | 0.9 | 0.0 | 0.0 | 7.2 | 8.1 | 0.0 | 38.5 |
| 448 | Methylenebis(4,1-phenylene) diisocyanate | 306.0 | 23.3 | 0.0 | 0.0 | 0.0 | 23.3 | 0.0 | 282.6 |
| 453 | Molybdenum and its compounds | 12.0 | 0.0 | 0.0 | 0.0 | 0.0 | 0.0 | 0.0 | 12.0 |
| 579 | Alpha-alkyl-omega-hydroxy poly: Oxyethane-1,2-diyl/oxy (methylethane-1,2-diyl) (This refers exclusively to branched alkyl groups with carbon counts varying between C9 and C11, with C10 being predominant.) | 42.9 | 0.0 | 0.0 | 0.0 | 0.0 | 0.0 | 42.9 | 0.0 |
| 585 | Alpha-(isocyanatobenzyl)-omega-(isocyanatophenyl)poly[(isocyanatophenylene)methylene] | 46.6 | 35.8 | 0.0 | 0.0 | 0.0 | 35.8 | 0.0 | 10.8 |
| 594 | Ethylene glycol monobutyl ether | 12,508.3 | 9.2 | 0.0 | 0.0 | 0.3 | 9.5 | 12,498.8 | 0.0 |
| 595 | Ethylenediaminetetraacetic acid and its potassium and sodium salts | 254.2 | 0.0 | 0.0 | 0.0 | 6.6 | 6.6 | 247.6 | 0.0 |
| 626 | Diethanolamine | 303.4 | 0.0 | 0.0 | 0.0 | 10.2 | 10.2 | 0.0 | 293.2 |
| 627 | Diethylene glycol monobutyl ether | 5,574.4 | 61.8 | 0.0 | 0.0 | 2.1 | 63.9 | 5,510.4 | 0.0 |
| 629 | Cyclohexane | 3,018.0 | 3,018.0 | 0.0 | 0.0 | 0.0 | 3,018.0 | 0.0 | 0.0 |
| 653 | Dimethyl (1-phenylethyl) benzene | 2.0 | 0.0 | 0.0 | 0.0 | 2.0 | 2.0 | 0.0 | 0.0 |
| 661 | 1,2-dimethoxyethane | 9.6 | 9.3 | 0.0 | 0.0 | 0.3 | 9.6 | 0.0 | 0.0 |
| 691 | Trimethylbenzenes | 18.1 | 18.0 | 0.0 | 0.0 | 0.2 | 18.1 | 0.0 | 0.0 |
| 698 | Nitrilotriacetic acid as the free acid and as the sodium salt | 55.1 | 0.0 | 0.0 | 0.0 | 55.1 | 55.1 | 0.0 | 0.0 |
| 708 | (1-Hydroxyethane-1,1-diyl)diphosphonic acid and its potassium and sodium salts | 17.4 | 17.4 | 0.0 | 0.0 | 0.0 | 17.4 | 0.0 | 0.0 |
| 731 | Heptane | 3,153.3 | 3,153.3 | 0.0 | 0.0 | 0.0 | 3,153.3 | 0.0 | 0.0 |
| 737 | Methyl isobutyl ketone | 30.7 | 30.7 | 0.0 | 0.0 | 0.0 | 30.7 | 0.0 | 0.0 |
| Total | 28,241.3 | 8,179.1 | 0.0 | 0.0 | 158.9 | 8,338 | 19,079.1 | 824.2 | |
-
*The data in the table above pertain to chemical substances designated as Specific Class 1 Designated Substances or (non-specific) Class 1 Designated Substances under the 2021 revision of the PRTR Law. Because the 2021 revision came into effect on April 1, 2023, our estimates for 2023 cover the period from April 1 to December 31, 2023, (as opposed to the entire year).
-
*These data items (volume handled, volume released, volume treated, and volume consumed) pertain to chemical substances designated as (non-specific) Class 1 Designated Substances handled in Japanese sites that are required under the PRTR Law to report the estimates.
For the calculation methods, see the Ministry of the Environment/Ministry of Economy, Trade and Industry’s PRTR Release Estimation Methods Manual, version 5.1 (March 2024). -
*“Volume treated” refers to those PRTR designated substances that were treated on site by incineration, neutralization, breaking down, reactive process, etc.
-
*“Volume consumed” refers to the volume of substances that were removed from the site by the removal of the products containing or accompanying them or that were modified for disposal by means of chemical reaction with other substances.
Environmental Load Material Flow
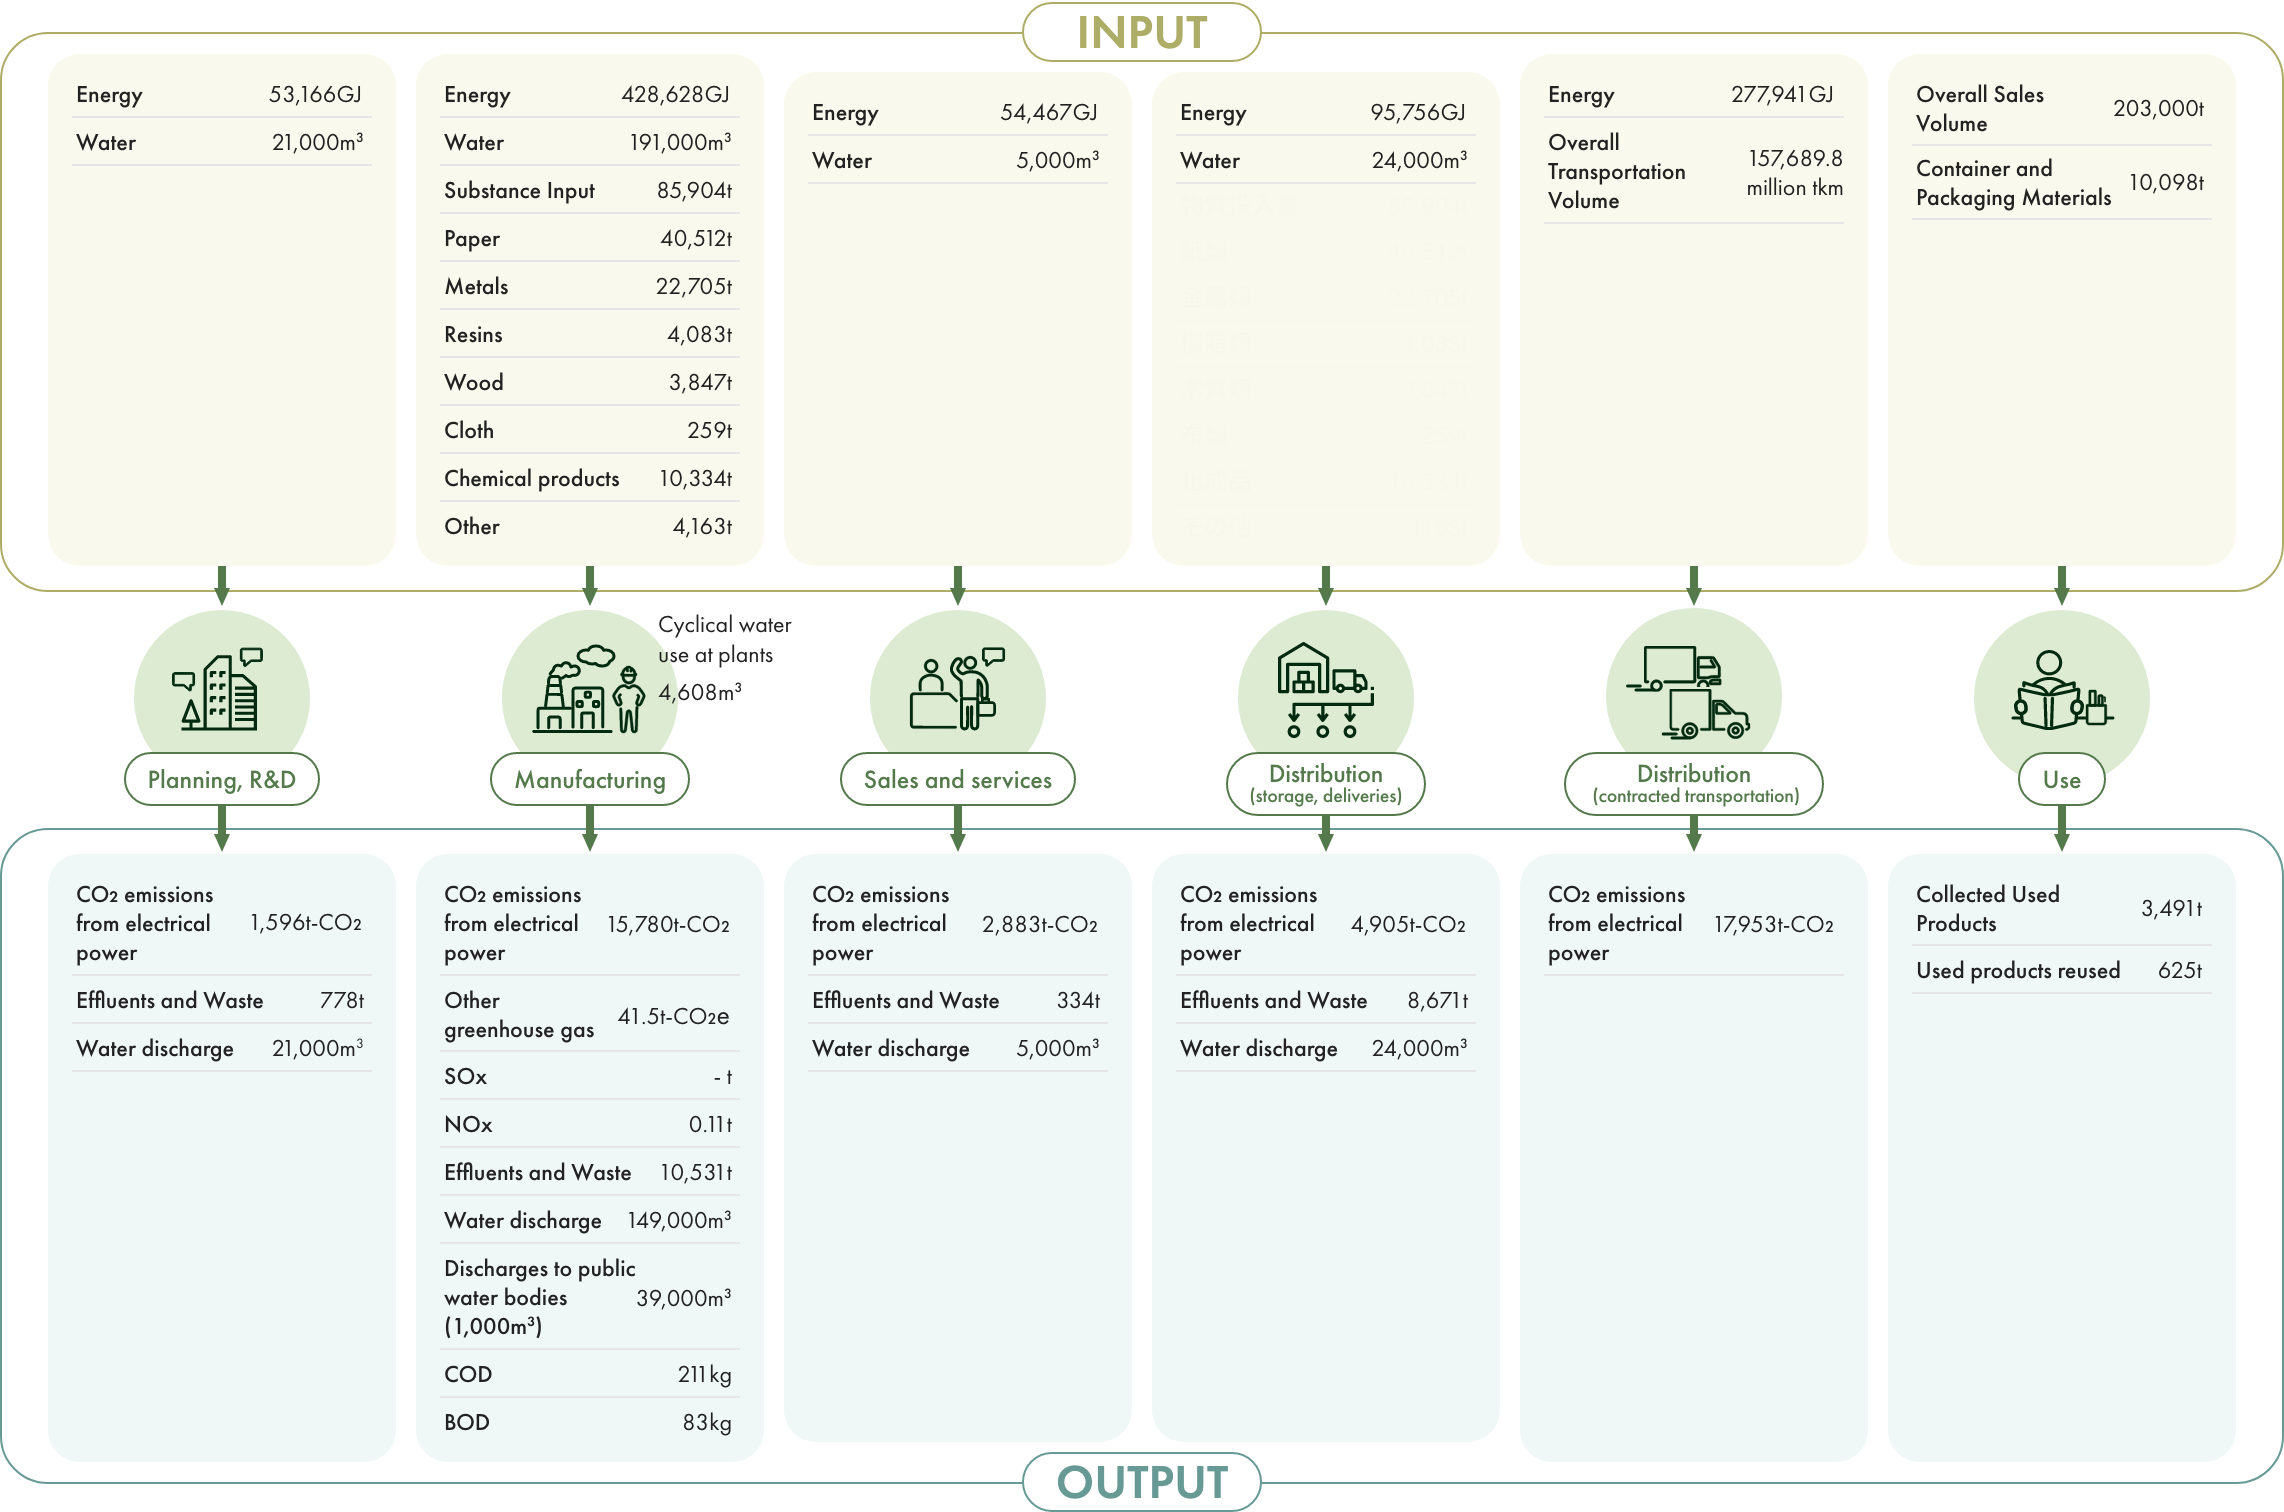
| Planning, R&D | Manufacturing | Sales and services | Distribution (storage, deliveries) | Distribution (contracted transportation) | Use | ||
|---|---|---|---|---|---|---|---|
| Inputs | Energy (GJ) | 53,166 | 428,628 | 54,467 | 95,756 | 277,941 | |
| Water discharge (1,000m3) | 21 | 191 | 5 | 24 | |||
| Total volume transported (million t km) | 157,689.8 | ||||||
| Substance inputs (t) | 85,904 | ||||||
| Paper (t) | 40,512 | ||||||
| Metals (t) | 22,705 | ||||||
| Resins (t) | 4,083 | ||||||
| Wood (t) | 3,847 | ||||||
| Cloth (t) | 259 | ||||||
| Chemical products (t) | 10,334 | ||||||
| Other (t) | 4,163 | ||||||
| Total volume sold (kt × 10) | 20.3 | ||||||
| Packaging (t) | 10,098 | ||||||
| Recycling | Cyclical water use at plants (m3) | 4,608 | |||||
| Outputs | CO2 emissions from electrical power (t-CO2) |
1,596 | 15,780 | 2,883 | 4,905 | 17,953 | |
| GHG emissions from sources other than electrical power (t-CO2e) | 41.5 | ||||||
| SOx (t) | ー | ||||||
| NOx (t) | 0.11 | ||||||
| Waste emissions (t) | 778 | 10,531 | 334 | 8,671 | |||
| Water discharge (1,000m3) | 21 | 149 | 5 | 24 | |||
| Discharges to public water bodies (1,000m3) | 39 | ||||||
| COD (kg) | 211 | ||||||
| BOD (kg) | 83 | ||||||
| Collected used products (t) | 3,491 | ||||||
| Used products reused (t) | 625 | ||||||
Input items
| Indicator | Unit | Calculation method |
|---|---|---|
| Volume of energy used | GJ |
Electricity, gas (city gas, LPG, natural gas), oil (gasoline, light oil, kerosene, fuel oil A), heat (hot water, cold water) The power unit calorific values are the daytime and nighttime power values stated in the Enforcement Regulations of the Act on the Rational Use of Energy (effective from April 1, 2008). The unit calorific values of gas, oil, and heat are those values presented in the Greenhouse Gas Emission Calculation and Reporting Manual, Ver. 6.0 (Mar 2025, Ministry of the Environment, Ministry of Economy, Trade and Industry). |
| Water | 1,000m3 | City/well water |
| Substance input | t | The volume of raw materials used to manufacture products in the plants of the KOKUYO Group |
| Total volume sold | kt × 10 | Data from furniture and stationery products |
| Container and packaging materials | t | The volume of packaging materials used to package products |
Output Items
| Indicator | Unit | Calculation method |
|---|---|---|
| CO2 emissions from electrical power | tCO2 |
Emissions from the use of electricity, gas, oil, and heat (see Global Warming Preventative Measures) Coefficients based on the Act on Promotion of Global Warming Countermeasures (adjusted emission coefficients based on the actual values in fiscal 2022 and 2023 for each power company) were used to calculate the CO2 emissions factors for power consumption in Japan. For power consumption overseas, we use the local emissions factors listed in IEA Emissions Factors 2024. CO2 emission coefficient values for gas, oil, and heat were taken from the Ministry of the Environment and the Ministry of Economy, Trade and Industry's Greenhouse Gas Emission Calculation and Reporting Manual, Ver. 6.0 (Mar 2025). The ton/kilo method and the fuel consumption method were both used to calculate the distribution (contracted transportation) CO2 emissions. |
| GHG emissions from sources other than electrical power | tCO2e | Total emissions of greenhouse gases (CO2, CH4, N2O) related to production activities in Japan, excluding such emissions from energy sources, have been converted to a CO2 basis. |
| SOx, Nox | t | Emissions from smoke- and soot-producing facilities at manufacturing plants (in Japan) |
| Effluents and Waste | t |
The volume of discharged waste (emissions) is the total amount of waste and valuable substances discharged from business establishments. The recycle volume is the total of the volume of discharged waste (emissions) that has been recycled through material or thermal recycling, and the volume of valuable substances. The final waste volume is the combined total of the recycling residue and the volume of waste directly disposed of in landfills, out of the total volume of discharged waste (solid waste) (see Resource Saving and Recycling). If industrial waste has been calculated by cubic measurement, conversion factors (reference) for converting cubic measurements of industrial waste into weights as stated in a notice released by the Ministry of the Environment (December 27, 2006; Env. Ind. Waste Issue No. 061227006) were used. |
| Water discharged | 1,000m3 | Wastewater discharged to areas of water for public use and into the sewage system |
| COD, BOD | kg | Of plants in Japan, the volume of effluent discharged to areas of water for public use by plants with a legal obligation to measure water quality |
Other items
| Indicator | Unit | Calculation method |
|---|---|---|
| Overall Transportation Volume | t km | The total of the following outsourced transportation volumes: total domestic transportation in Japan including the transportation of furniture products, store fixtures, stationery products, transportation of catalog sales by Kaunet, and transportation of Actus products; and transportation of products between overseas sites and within Malaysia. |
| Cyclical water use at plants | m3 | The volume of water used in a cyclical way (i.e. recycled) on business premises |
| Cyclical Resource Use on Sites | t | The volume of recycled resources, such as packaging materials, on the business premises of KOKUYO Logitem Co., Ltd. and KOKUYO Supply Logistics Co., Ltd. |
| Collected Used Products | t | The volume of used products collected from customers by KOKUYO Logitem Co., Ltd. |
| Used products reused | t | The volume of re-used products from the used products collected from customers by KOKUYO Logitem Co., Ltd. |
Environmental Accounting
Environmental Accounting
Unit: 10,000 yen
| Theme | Environment-related Investments | Costs | Effects | Total | ||||||||
|---|---|---|---|---|---|---|---|---|---|---|---|---|
| 2022 | 2023 | 2024 | 2022 | 2023 | 2024 | 2022 | 2023 | 2024 | 2022 | 2023 | 2024 | |
| Pollution prevention | 0 | 0 | 0 | 1,497 | 2,267 | 2,123 | 0 | 0 | 0 | 1,497 | 2,267 | 2,123 |
| Global warming prevention | 7,354 | 945 | 10,570 | 2,388 | 4,194 | 2,994 | -1,359 | -1,142 | -973 | 1,029 | 3,052 | 2,021 |
| Resource Conservation and Recycling | 0 | 0 | 0 | 50,045 | 45,174 | 47,137 | -24,717 | -24,548 | -25,765 | 25,328 | 20,626 | 21,372 |
| Procurement and provision of eco-friendly products | 0 | 0 | 0 | 4,940 | 3,395 | 3,192 | 0 | 0 | 0 | 4,940 | 3,395 | 3,192 |
| Survey and research into environmental technology | 0 | 0 | 0 | 148 | 317 | 638 | 0 | 0 | 0 | 148 | 317 | 638 |
| Environmental communication | 0 | 0 | 0 | 3,529 | 3,521 | 2,590 | 0 | 0 | 0 | 3,529 | 3,521 | 2,590 |
| Setting up management structures | 0 | 0 | 0 | 8,574 | 10,715 | 9,448 | 0 | 0 | 0 | 8,574 | 10,715 | 9,448 |
| Environmental damage response | 0 | 0 | 0 | 0 | 0 | 0 | 0 | 0 | 0 | 0 | 0 | 0 |
| Total | 7,354 | 945 | 10,570 | 71,121 | 69,583 | 68,120 | -26,076 | -25,690 | -26,738 | 45,045 | 43,893 | 41,383 |
Breakdown of economic effects
| Theme | Content of countermeasures | 2022 | 2023 | 2024 |
|---|---|---|---|---|
| Global warming prevention | Effects of introducing energy-saving facilities | -406 | -158 | -40 |
| Effects of solar power generation | -936 | -976 | -899 | |
| Effects of improving operations | -17 | -8 | -34 | |
| Resource Conservation and Recycling | Proceeds from garbage sorting and recycling | -24,717 | -24,548 | -25,765 |
| Waste Reduction | 0 | 0 | 0 | |
| Cost reductions achieved through the promotion of recycling | 0 | 0 | 0 | |
| Total | -26,076 | -25,690 | -26,738 |
Sites with ISO 14001 Certification
Seventy-four (approximately 50%) of the 155 sites in KOKUYO and its consolidated subsidiaries have received ISO 14001 certification.
| No. | Company Name | Site Name |
|---|---|---|
| 1 | KOKUYO | KOKUYO Head Office (including XT and WS) |
| 2 | Tokyo Shinagawa Office | |
| 3 | Tokyo Shinagawa SST Office | |
| 4 | Tokyo Kasumigaseki Office | |
| 5 | Nagoya Office | |
| 6 | Osaka Umeda Office | |
| 7 | Mie Plant | |
| 8 | Shibayama Plant | |
| 9 | KOKUYO MVP Co., Ltd. | Tottori Plant |
| 10 | Aoya Plant | |
| 11 | KOKUYO Product Shiga Co., Ltd. | KOKUYO Head Office |
| 12 | KOKUYO Logitem Co., Ltd. | KOKUYO Head Office |
| 13 | Sapporo Distribution Center | |
| 14 | Sendai Distribution Center | |
| 15 | Gunma Distribution Center | |
| 16 | Saitama Distribution Center | |
| 17 | Central Japan Delivery and Distribution Center | |
| 18 | Central Japan Delivery Center | |
| 19 | Kanagawa Distribution Center | |
| 20 | Shin Chiba Distribution Center | |
| 21 | Shiga Distribution Center | |
| 22 | Mie Distribution Center | |
| 23 | Ina Distribution Center | |
| 24 | Chubu Delivery and Distribution Center | |
| 25 | Toyama Distribution Center | |
| 26 | Fujiwara Distribution Center | |
| 27 | Komono Distribution Center | |
| 28 | Kyoto-Shiga Distribution Center | |
| 29 | Kansai Delivery and Distribution Center | |
| 30 | Okayama Distribution Center | |
| 31 | Kyushu Distribution Center | |
| 32 | KOKUYO Supply Logistics Co., Ltd. | KOKUYO Head Office |
| 33 | Sapporo Distribution Center | |
| 34 | Ibaraki Distribution Center | |
| 35 | Metropolitan Area Internet Data Center | |
| 36 | Chubu Internet Data Center | |
| 37 | Shiga National Data Center | |
| 38 | Kinki Internet Data Center | |
| 39 | Osaka Nanko Distribution Center | |
| 40 | Kyushu Internet Data Center | |
| 41 | Fukuoka Distribution Center | |
| 42 | Kaunet Co., Ltd. | KOKUYO Head Office |
| 43 | Tokyo Shinagawa Office | |
| 44 | KOKUYO Marketing Co., Ltd. | KOKUYO Head Office |
| 45 | Tachikawa Office | |
| 46 | Chiba Office | |
| 47 | Saitama Office | |
| 48 | Yokohama Office | |
| 49 | Nagano Office | |
| 50 | Nagoya Office | |
| 51 | Shizuoka Office | |
| 52 | Umeda Office | |
| 53 | Kyoto Office | |
| 54 | Kobe Office | |
| 55 | Wakayama Office | |
| 56 | Hiroshima Office | |
| 57 | Yamaguchi Office | |
| 58 | Matsue Office | |
| 59 | Fukuoka Office | |
| 60 | Nagasaki Office | |
| 61 | Miyazaki Office | |
| 62 | Kagoshima Office | |
| 63 | Kumamoto Office | |
| 64 | Oita Office | |
| 65 | Okinawa Office | |
| 66 | KOKUYO (Malaysia) | KOKUYO Head Office |
| 67 | KOKUYO-IK (Thailand) | KOKUYO Head Office |
| 68 | KOKUYO Camlin | Patalganga Plant |
| 69 | Tarapur Plant | |
| 70 | Samba Plant | |
| 71 | KOKUYO Commerce (Shanghai) Co., Ltd. | KOKUYO Head Office |
| 72 | Beijing Office | |
| 73 | Shenzhen Office | |
| 74 | Lamex | Dongguan Plant |
Yui-no-Mori: Wildlife survey results
On June 16 and 17, 2023, an ornithologist helped us identify the birds that appeared in the footage.
Mammals identified
| Order | Family | Common name | Binominal name |
|---|---|---|---|
| Primates | Cercopithecidae | Macaca fuscata | Macaca fuscata |
| Rodentia | Muridae | Apodemus argenteus | Apodemus argenteus |
| Unidentified murid species | |||
| Sciuridae | Petaurista leucogenys | Petaurista leucogenys | |
| Pteromys Momonga | Pteromys momonga | ||
| Gliridae | Glirulus japonicus | Glirulus japonicus | |
| Chiroptera | Chiroptera | Chiroptera | |
| Carnivora | Canidea | Nyctereutes procyonoides | Nyctereutes procyonoides |
| Mustelidae | Meles anakuma | Meles anakuma | |
| Martes melampus | Martes melampus | ||
| Mustelidae | |||
| Viverridae | Paguma larvata | Paguma larvata | |
| Lagomorpha | Leporidae | Lepus brachyurus | Lepus brachyurus |
| Artiodactyla | Suidae | Sus scrofa | Sus scrofa |
| Cervidae | Cervus nippon | Cervus nippon | |
| 6 | 10 | 11 |
-
*Families and species were only counted if the family or species could be distinguished.
Birds identified
| Order | Family | Common name | Binominal name |
|---|---|---|---|
| Columbiformes | Columbidae | Streptopelia orientalis | Streptopelia orientalis |
| Treron sieboldii | Treron sieboldii | ||
| Suliformes | Phalacrocoracidae | Phalacrocorax carbo | Phalacrocorax carbo |
| Cuculiformes | Cuculidae | Hierococcyx hyperythrus | Hierococcyx hyperythrus |
| Cuculus poliocephalus | Cuculus poliocephalus | ||
| Accipitriformes | Accipitridae | Milvus migrans | Milvus migrans |
| Accipiter gentilis | Accipiter gentilis | ||
| Butastur indicus | Butastur indicus | ||
| Strigiformes | Strigidae | Strix uralensis | Strix uralensis |
| Otus semitorques | Otus semitorques | ||
| Ninox japonica | Ninox japonica | ||
| Coraciiformes | Alcedinidae | Halcyon coromanda | Halcyon coromanda |
| Alcedo atthis | Alcedo atthis | ||
| Megaceryle lugubris | Megaceryle lugubris | ||
| Coraciidae | Eurystomus orientalis | Eurystomus orientalis | |
| Galliformes | Phasianidae | Syrmaticus soemmerringii | Syrmaticus soemmerringii |
| Piciformes | Picidae | Dendrocopos kizuki | Dendrocopos kizuki |
| Picus awokera | Picus awokera | ||
| Passeriformes | Pittidae | Pitta nympha | Pitta nympha |
| Campephagidae | Pericrocotus divaricatus tegimae | Pericrocotus divaricatus tegimae | |
| Monarchidae | Terpsiphone atrocaudata | Terpsiphone atrocaudata | |
| Corvidae | Garrulus glandarius | Garrulus glandarius | |
| Corvus macrorhynchos | Corvus macrorhynchos | ||
| Paridae | Sittiparus varius | Sittiparus varius | |
| Parus minor | Parus minor | ||
| Pycnonotidae | Hypsipetes amaurotis | Hypsipetes amaurotis | |
| Cettiidae | Horornis diphone | Horornis diphone | |
| Aegithalidae | Aegithalos caudatus | Aegithalos caudatus | |
| Phylloscopidae | Phylloscopus coronatus | Phylloscopus coronatus | |
| Zosteropidae | Zosterops japonicus | Zosterops japonicus | |
| Certhiidae | Certhia familiaris | Certhia familiaris | |
| Troglodytidae | Troglodytes | Troglodytes troglodytes | |
| Cinclidae | Cinclus pallasii | Cinclus pallasii | |
| Muscicapidae | Zoothera aurea | Zoothera aurea | |
| Turdus cardis | Turdus cardis | ||
| Ficedula narcissina | Ficedula narcissina | ||
| Cyanoptila cyanomelana | Cyanoptila cyanomelana | ||
| Passeridae | Passer montanus | Passer montanus | |
| Motacillidae | Motacilla cinerea | Motacilla cinerea | |
| Motacilla grandis | Motacilla grandis | ||
| Fringillidae | Chloris sinica | Chloris sinica | |
| Eophona personata | Eophona personata | ||
| Emberizidae | Emberiza cioides | Emberiza cioides | |
| 9 | 27 | 43 |
| Invasive species | Bambusicola thoracicus | Bambusicola thoracicus |
|---|---|---|
| Urocissa erythrorhyncha | Urocissa erythrorhyncha | |
| Leiothrix lutea | Leiothrix lutea |