ESG DATA
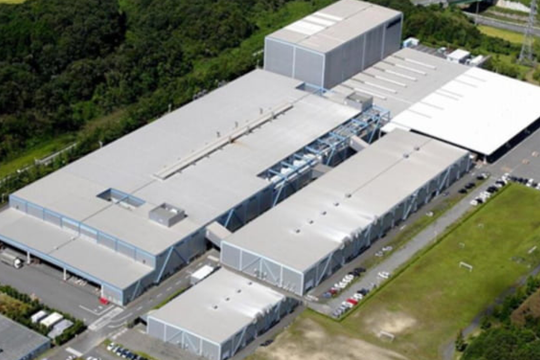
KOKUYO (MIE PLANT)
| LOCATION | 2012 Nishitawara, Nabari-shi, Mie |
|---|---|
| PRINCIPAL PRODUCTS | Steel desks, low partitions, chairs, etc. |
| COMMENCEMENT OF OPERATIONS | May 1993 |
| SITE AREA | 145,977m2 |
| Inputs | 2022 | 2023 | 2024 | |
|---|---|---|---|---|
| Energy (GJ) | Volume of energy inputs | 100,880 | 90,943 | 87,051 |
| Fuel | 39,532 | 36,637 | 34,827 | |
| Electricity | 61,348 | 54,306 | 52,224 | |
| Water resources (m3) | City/well water | 64,067 | 64,252 | 50,242 |

| Outputs | 2022 | 2023 | 2024 | |
|---|---|---|---|---|
| Atmospheric emissions (t) | CO2 | 4,310 | 1,864 | 1,787 |
| SOx | - | - | - | |
| NOx | 0.13 | 0.11 | 0.11 | |
| Waste emissions (t) | Total waste volume | 1,265 | 1,160 | 1,169 |
| Reuse/heat recovery | 1,261 | 1,153 | 1,161 | |
| Final disposal | 3 | 7 | 8 | |
| Emissions into bodies of water (m3) | Volume of effluent | 31,097 | 29,974 | 29,062 |
| Emissions into public water areas | 31,097 | 29,974 | 29,062 | |
| Emissions into sewage systems | - | - | - | |
| Restricted items emitted into bodies of water | Hydrogen ion concentration (PH) | 7.6~8.0 | 7.5~8.1 | 7.7~8.1 |
| COD (mg/L) | 8.6 | 9 | 8.9 | |
| BOD (mg/L) | 2.4 | 3.9 | 3.5 | |
| SS (mg/L) | 2.3 | 3.5 | 2.5 | |