ESG Data, Further Reading
ESG DATA: SOCIAL
Reporting Period
January 1 to December 31 of the applicable year (the results are current as of December 31)
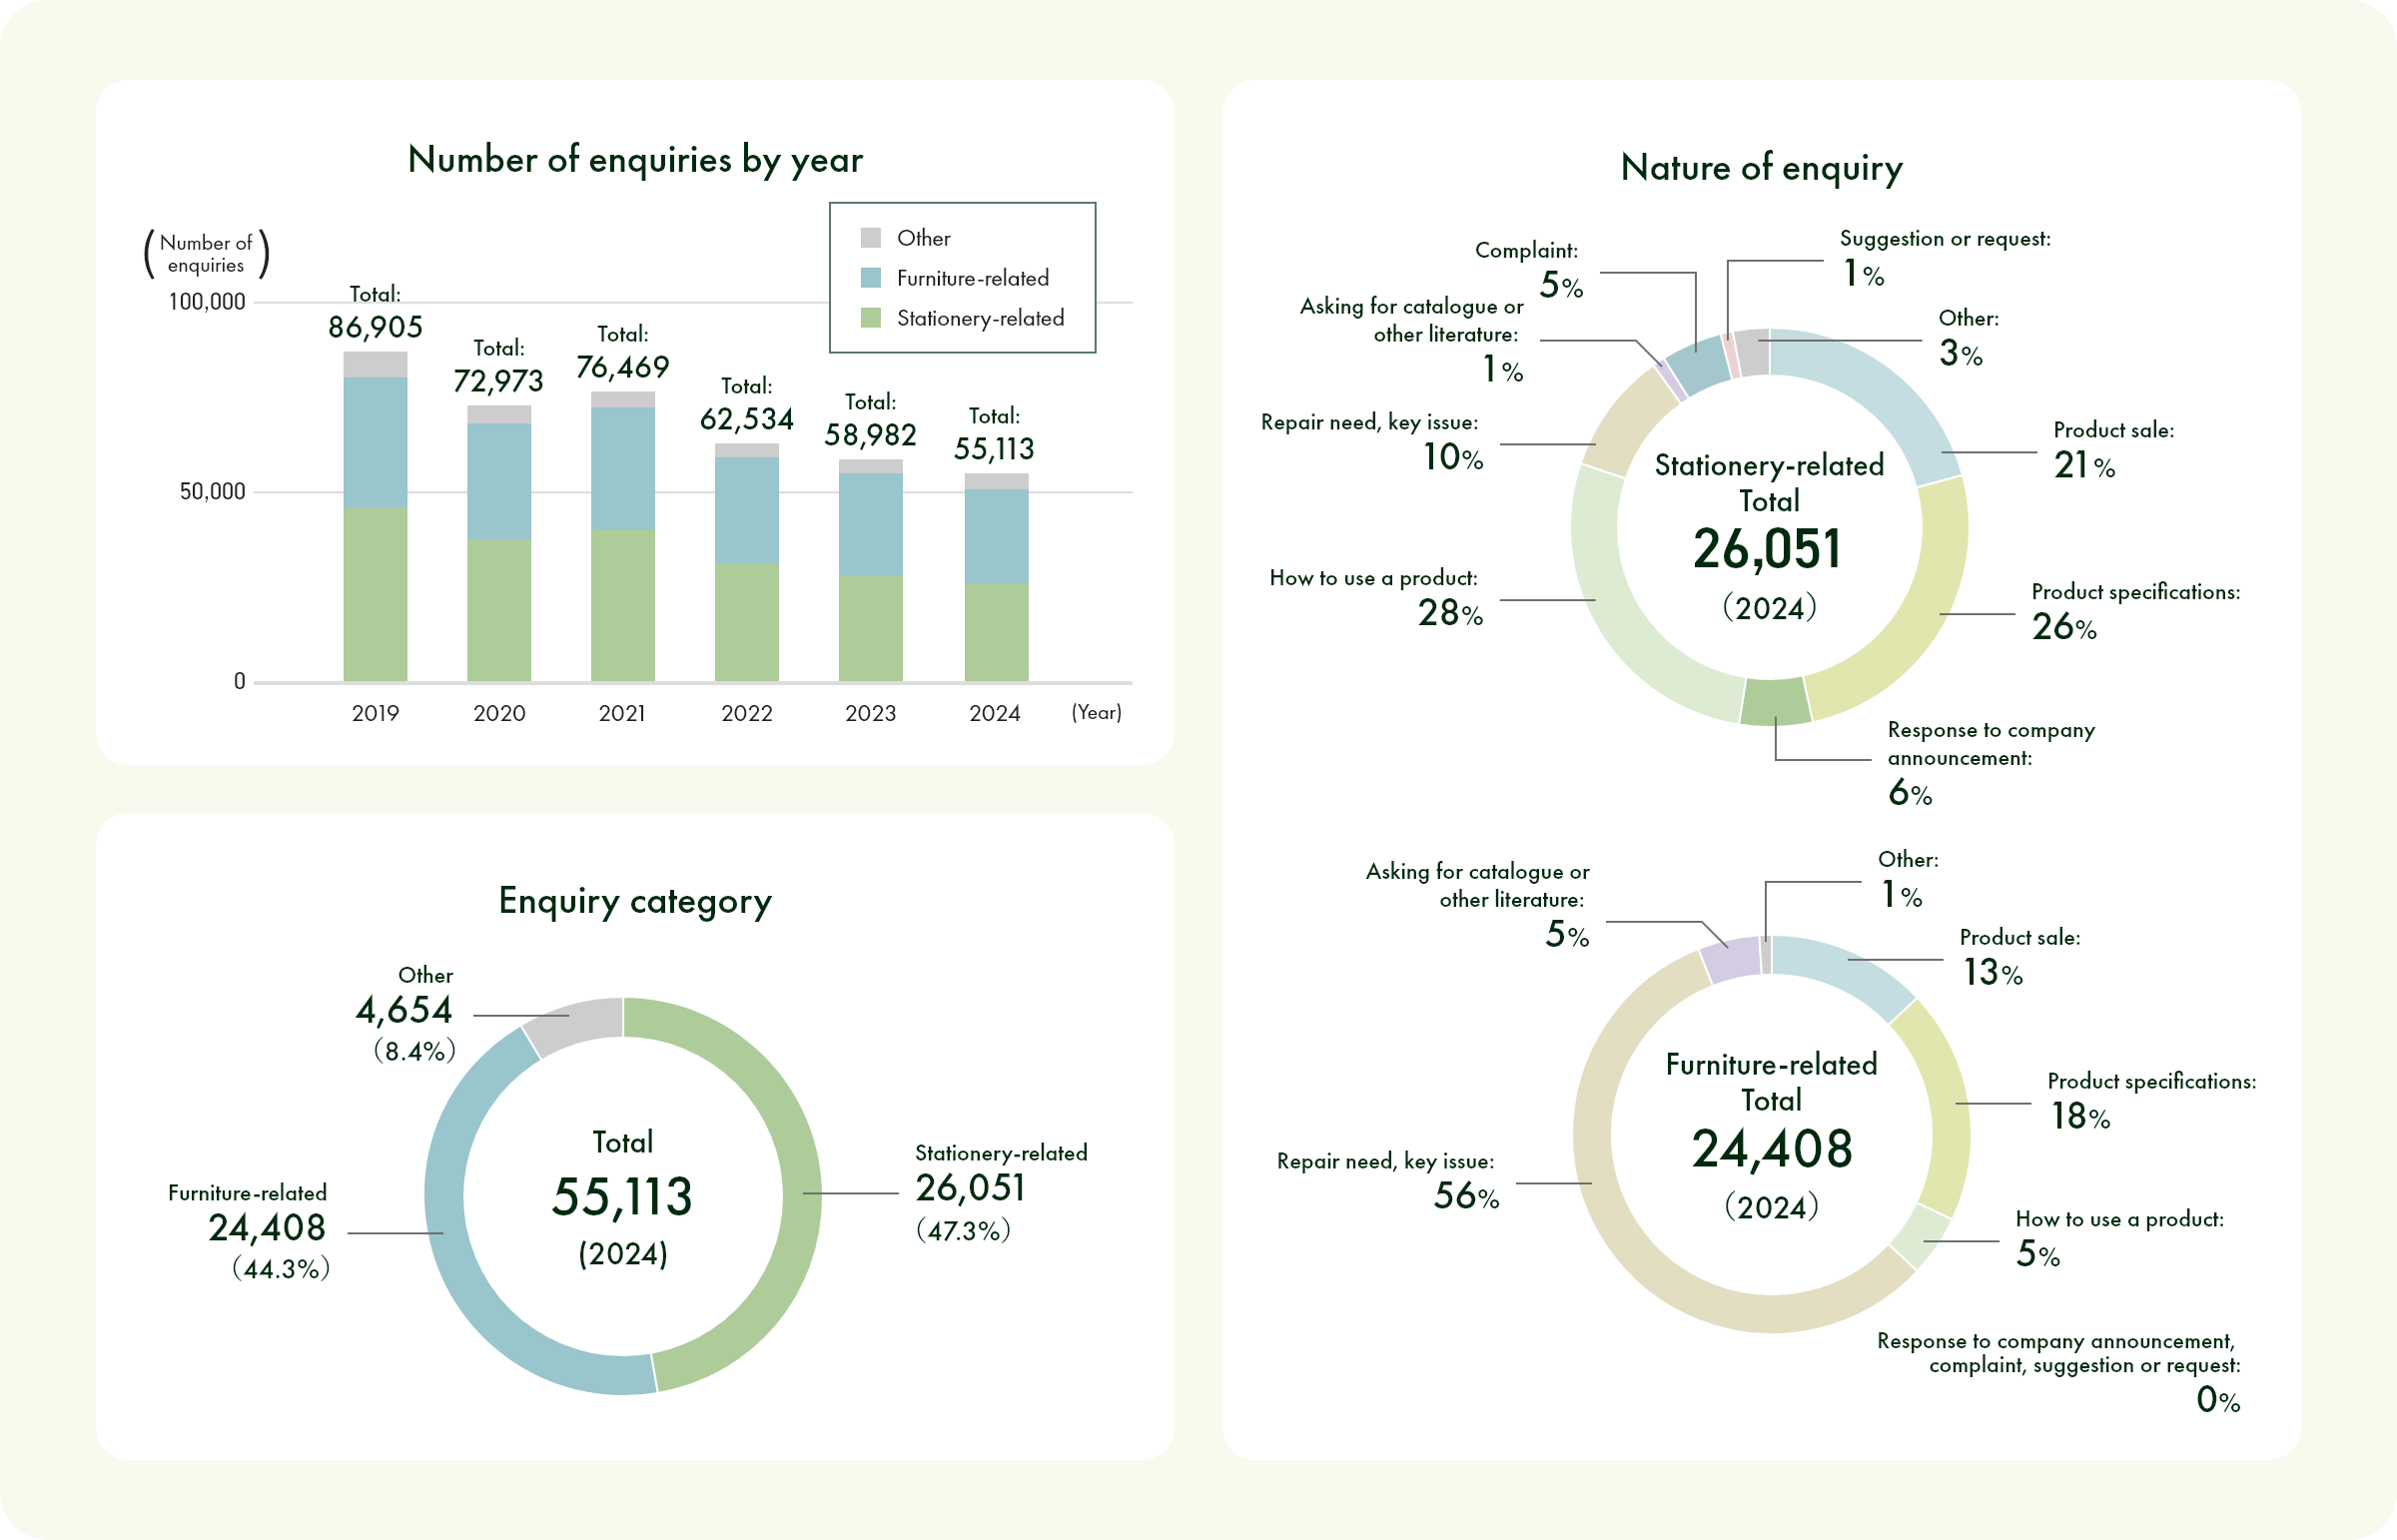
Listening to Customers
Employee Composition: By Position
| Coverage | 2020 | 2021 | 2022 | 2023 | 2024 | ||
|---|---|---|---|---|---|---|---|
| Number of Executives and Directors | Inside | Non-consolidated | 4 | 3 | 2 | 2 | 3 |
| Outside | Non-consolidated | 3 | 4 | 4 | 4 | 6 | |
| Total | Non-consolidated | 7 | 7 | 6 | 6 | 9 | |
| Number of members of the Audit & Supervisory Board | Inside | Non-consolidated | 0 | 1 | 1 | 1 | 0 |
| Outside | Non-consolidated | 3 | 2 | 2 | 2 | 0 | |
| Total | Non-consolidated | 3 | 3 | 3 | 3 | 0 | |
| Number of employees | Male | Non-consolidated | 1,634 | 1,601 | 1,452 | 1,480 | 1,531 |
| Female | Non-consolidated | 607 | 606 | 610 | 662 | 730 | |
| Total | Non-consolidated | 2,241 | 2,207 | 2,062 | 2,142 | 2,261 | |

Employee Composition: By Gender
| Coverage | 2020 | 2021 | 2022 | 2023 | 2024 | ||
|---|---|---|---|---|---|---|---|
| Number of employees (KOKUYO Group) | Male | Consolidated | 4,899 | 4,915 | 4,645 | 4,624 | 4,912 |
| Female | Consolidated | 1,983 | 1,910 | 2,219 | 2,307 | 2,735 | |
| Total | Consolidated | 6,882 | 6,825 | 6,864 | 6,931 | 7,647 | |
Employee Composition: By Contract Type and by Gender
| Coverage | 2020 | 2021 | 2022 | 2023 | 2024 | ||
|---|---|---|---|---|---|---|---|
| Total number of employees*1 | Consolidated | 6,882 | 6,825 | 6,864 | 6,931 | 7,647 | |
| Non-regular employees*1 | Consolidated | 2,333 | 2,711 | 4,097 | 3,785 | 3,775 | |
| Non-regular employees*1 | Consolidated | 25.31 | 28.43 | 37.38 | 35.32 | 33.05 | |
| Regular employees | Male | Five main group companies | 2,511 | 2,511 | 2,480 | 2,473 | 2,529 |
| Female | Five main group companies | 888 | 928 | 960 | 1,029 | 1,121 | |
| Total | Five main group companies | 3,399 | 3,439 | 3,440 | 3,502 | 3,650 | |
| Senior employees | Male | Five main group companies | 268 | 256 | 263 | 239 | 257 |
| Female | Five main group companies | 8 | 11 | 14 | 19 | 25 | |
| Total | Five main group companies | 276 | 267 | 277 | 258 | 282 | |
| Contracted employees | Male | Five main group companies | 105 | 83 | 60 | 58 | 60 |
| Female | Five main group companies | 102 | 101 | 91 | 88 | 96 | |
| Total | Five main group companies | 207 | 184 | 151 | 146 | 156 | |
| Part-time/casual employees | Male | Five main group companies | 118 | 112 | 133 | 123 | 97 |
| Female | Five main group companies | 180 | 188 | 195 | 188 | 165 | |
| Total | Five main group companies | 298 | 300 | 328 | 311 | 262 | |
| Temporary employees | Male | Five main group companies | 142 | 128 | 183 | 203 | 227 |
| Female | Five main group companies | 167 | 146 | 199 | 261 | 270 | |
| Total | Five main group companies | 309 | 274 | 382 | 464 | 497 | |
-
*The five main group companies are: KOKUYO Co., Ltd., Kaunet Co., Ltd., KOKUYO Marketing Co., Ltd., KOKUYO Supply Logistics Co., Ltd., and KOKUYO Logitem Co., Ltd.
-
*1In 2022, we changed the definitions of regular and non-regular employees.
Previous definition:
Regular employee = A managing officer + non-managerial regular employee + senior employee
Non-regular employee = A contracted employee + part-time or casual employee
Current definition:
Regular employee = A managing officer + non-managerial regular employee
Non-regular employee = A senior employee + contracted employee + part-time or casual employee
Employee Composition: By Contract Type and by Region
| Coverage | 2020 | 2021 | 2022 | 2023 | 2024 | ||
|---|---|---|---|---|---|---|---|
| Regular employees | Within Japan | Consolidated | 4,145 | 4,183 | 4,218 | 4,294 | 4,586 |
| Overseas | Consolidated | 2,347 | 2,308 | 2,646 | 2,637 | 3,061 | |
| Total | Consolidated | 6,492 | 6,491 | 6,864 | 6,931 | 7,647 | |
| Senior employees | Within Japan | Consolidated | 322 | 308 | 328 | 315 | 341 |
| Overseas | Consolidated | 4 | 2 | 18 | 19 | 29 | |
| Total | Consolidated | 326 | 310 | 346 | 334 | 370 | |
| Contracted employees | Within Japan | Consolidated | 564 | 598 | 631 | 654 | 742 |
| Overseas | Consolidated | 36 | 70 | 533 | 512 | 341 | |
| Total | Consolidated | 600 | 668 | 1,164 | 1,166 | 1,083 | |
| Part-time/casual employees | Within Japan | Consolidated | 553 | 571 | 575 | 542 | 512 |
| Overseas | Consolidated | 4 | 2 | 21 | 4 | 13 | |
| Total | Consolidated | 557 | 573 | 596 | 546 | 525 | |
| Temporary employees | Within Japan | Consolidated | 379 | 331 | 434 | 511 | 539 |
| Overseas | Consolidated | 974 | 1,162 | 1,557 | 1,228 | 1,258 | |
| Total | Consolidated | 1,353 | 1,493 | 1,991 | 1,739 | 1,797 | |
Employee Composition: By Age, Average Ages of Male and Female Employees, Average Tenure
| Coverage | 2020 | 2021 | 2022 | 2023 | 2024 | ||
|---|---|---|---|---|---|---|---|
| Number of employees by age group | Under 30 | Five main group companies | 470 | 469 | 465 | 506 | 600 |
| 30s | Five main group companies | 591 | 595 | 619 | 665 | 710 | |
| 40s | Five main group companies | 1,150 | 1,076 | 965 | 894 | 858 | |
| 50s | Five main group companies | 1,188 | 1,299 | 1,379 | 1,439 | 1,482 | |
| 60s or older | Five main group companies | 276 | 267 | 0 | 1 | 0 | |
| Average age | Male | Five main group companies | 46.8 | 47.22 | 45.8 | 45.77 | 45.26 |
| Female | Five main group companies | 39.32 | 39.79 | 40.05 | 39.97 | 39.32 | |
| Average | Five main group companies | 44.98 | 45.34 | 44.21 | 44.07 | 43.44 | |
| Average length of continuous service (years) | Male | Five main group companies | 20.9 | 21.31 | 19.94 | 19.78 | 18.92 |
| Female | Five main group companies | 13.83 | 14.05 | 14.16 | 13.7 | 12.91 | |
| Average | Five main group companies | 19.18 | 19.47 | 18.34 | 18 | 17.08 | |
-
*The five main group companies are: KOKUYO Co., Ltd., Kaunet Co., Ltd., KOKUYO Marketing Co., Ltd., KOKUYO Supply Logistics Co., Ltd., and KOKUYO Logitem Co., Ltd.
Employee Composition: By Nationality
| Coverage | 2020 | 2021 | 2022 | 2023 | 2024 | ||
|---|---|---|---|---|---|---|---|
| Number of employees | Non-Japanese employees in the five main group companies | Five main group companies | 11 | 11 | 12 | 28 | 28 |
| Non-Japanese employees at KOKUYO | Non-consolidated | 11 | 9 | 10 | 25 | 24 | |
Employees Composition: Employees with Disabilities
| Coverage | 2020 | 2021 | 2022 | 2023 | 2024 | |
|---|---|---|---|---|---|---|
| Number of employees with disabilities | Group companies implementing | 129 | 134 | 134 | 137.5 | 153 |
| Percentage of employees who have a disability (%) | Group companies implementing | 2.3 | 2.37 | 2.33 | 2.38 | 2.55 |
Breakdown of New Hires
| Coverage | 2020 | 2021 | 2022 | 2023 | 2024 | ||
|---|---|---|---|---|---|---|---|
| Number of fresh graduate hires | Male | Five main group companies | 40 | 28 | 35 | 42 | 66 |
| Female | Five main group companies | 40 | 18 | 18 | 29 | 65 | |
| Total | Five main group companies | 80 | 46 | 53 | 71 | 131 | |
| Number of mid-career hires | Male | Five main group companies | 28 | 23 | 47 | 81 | 110 |
| Female | Five main group companies | 23 | 24 | 26 | 59 | 60 | |
| Total | Five main group companies | 51 | 47 | 73 | 140 | 170 | |
| Percentage of mid-career hires (%) | KOKUYO | 22 | 29 | 43 | 54 | 46 | |
| Turnover rate (%) | Male | Five main group companies | 1.96 | 1.39 | 1.91 | 2.59 | 2.17 |
| Female | Five main group companies | 1.81 | 1.56 | 2.65 | 1.87 | 2.23 | |
| Total | Five main group companies | 1.93 | 1.44 | 2.11 | 2.4 | 2.19 | |
-
*The five main group companies are: KOKUYO Co., Ltd., Kaunet Co., Ltd., KOKUYO Marketing Co., Ltd., KOKUYO Supply Logistics Co., Ltd., and KOKUYO Logitem Co., Ltd.
Managerial Appointments: By Gender
| Coverage | 2020 | 2021 | 2022 | 2023 | 2024 | |||
|---|---|---|---|---|---|---|---|---|
| Number of managerial appointments | Executives and higher (includes managing officers) |
Male | Five main group companies | 22 | 20 | 18 | 19 | 21 |
| Female | Five main group companies | 1 | 2 | 2 | 2 | 2 | ||
| Department heads | Male | Five main group companies | 65 | 77 | 95 | 198 | 205 | |
| Female | Five main group companies | 4 | 2 | 2 | 5 | 5 | ||
| Section chiefs | Male | Five main group companies | 732 | 768 | 808 | 668 | 645 | |
| Female | Five main group companies | 55 | 69 | 78 | 85 | 99 | ||
| Sub-section chiefs | Male | Five main group companies | 1,066 | 1,034 | 1,009 | 1,016 | 938 | |
| Female | Five main group companies | 288 | 314 | 337 | 361 | 404 | ||
| Total | Five main group companies | 2,234 | 2,286 | 2,349 | 2,354 | 2,319 | ||
-
*The five main group companies are: KOKUYO Co., Ltd., Kaunet Co., Ltd., KOKUYO Marketing Co., Ltd., KOKUYO Supply Logistics Co., Ltd., and KOKUYO Logitem Co., Ltd.
Managerial Appointments: Percentage of Managerial Posts Occupied by Women
| Coverage | 2020 | 2021 | 2022 | 2023 | 2024 | ||
|---|---|---|---|---|---|---|---|
| Percentage of middle management posts (department heads, section chiefs) occupied by women (%) | Five main group companies | 6.89 | 7.75 | 8.14 | 9.41 | 10.9 | |
| Managerial posts (sub-section chief or higher) occupied by women (%) | Executives and higher (includes managing officers) |
Five main group companies | 8.33 | 9.09 | 10 | 9.52 | 8.7 |
| Department heads | Five main group companies | 5.80 | 2.53 | 2.06 | 2.46 | 2.38 | |
| Section chiefs | Five main group companies | 6.99 | 8.24 | 8.8 | 11.29 | 13.31 | |
| Sub-section chiefs | Five main group companies | 21.27 | 23.29 | 25.04 | 26.22 | 30.1 | |
| Total | Five main group companies | 15.62 | 16.93 | 17.84 | 19.24 | 21.99 | |
-
*The five main group companies are: KOKUYO Co., Ltd., Kaunet Co., Ltd., KOKUYO Marketing Co., Ltd., KOKUYO Supply Logistics Co., Ltd., and KOKUYO Logitem Co., Ltd.
Non-Japanese People Appointed to Managerial Positions
| Coverage | 2020 | 2021 | 2022 | 2023 | 2024 | ||
|---|---|---|---|---|---|---|---|
| Managerial appointments: Non-Japanese managers | Executives and higher | Five main group companies | 0 | 0 | 0 | 0 | 0 |
| Department heads | Five main group companies | 0 | 0 | 0 | 0 | 0 | |
| Section chiefs | Five main group companies | 3 | 3 | 4 | 4 | 5 | |
| Sub-section chiefs | Five main group companies | 6 | 5 | 5 | 5 | 4 | |
| Total | Five main group companies | 9 | 8 | 9 | 9 | 9 | |
-
*The five main group companies are: KOKUYO Co., Ltd., Kaunet Co., Ltd., KOKUYO Marketing Co., Ltd., KOKUYO Supply Logistics Co., Ltd., and KOKUYO Logitem Co., Ltd.
Managerial Appointments: Percentage of Managerial Posts Occupied by Non-Japanese Employees
| Coverage | 2020 | 2021 | 2022 | 2023 | 2024 | ||
|---|---|---|---|---|---|---|---|
| Percentage of managerial posts occupied by non-Japanese employees (%) | Executives and higher | Five main group companies | 0.00 | 0.00 | 0.00 | 0.00 | 0.00 |
| Department heads | Five main group companies | 0.00 | 0.00 | 0.00 | 0.00 | 0.00 | |
| Section chiefs | Five main group companies | 0.38 | 0.36 | 0.45 | 0.45 | 0.64 | |
| Sub-section chiefs | Five main group companies | 0.44 | 0.37 | 0.37 | 0.37 | 0.28 | |
| Total | Five main group companies | 0.40 | 0.35 | 0.38 | 0.38 | 0.36 | |
-
*The five main group companies are: KOKUYO Co., Ltd., Kaunet Co., Ltd., KOKUYO Marketing Co., Ltd., KOKUYO Supply Logistics Co., Ltd., and KOKUYO Logitem Co., Ltd.
Working Hours, Paid Leave Take-up Rate
| Coverage | 2020 | 2021 | 2022 | 2023 | 2024 | |
|---|---|---|---|---|---|---|
| Total working hours per year | Five main group companies | 2,056.7 | 2,092.5 | 2,087.7 | 2,023.2 | 2,065 |
| Non-prescribed working hours per year | Five main group companies | 226.9 | 260.3 | 269.1 | 237.2 | 252 |
| Long-time worker rate (over 360 hours of total annual overtime) (%) | Five main group companies | 17.4 | 24.0 | 25.2 | 19.0 | 22.6 |
| Paid leave uptake rate (%) | Five main group companies | 48.9 | 48.4 | 54.3 | 61.7 | 71.1 |
| Yearly education and training costs per employee (yen) | Five main group companies | 35,562 | 39,107 | 42,955 | 54,554 | 62,554 |
-
*The five main group companies are: KOKUYO Co., Ltd., Kaunet Co., Ltd., KOKUYO Marketing Co., Ltd., KOKUYO Supply Logistics Co., Ltd., and KOKUYO Logitem Co., Ltd.
Number of Employees on Childcare Leave: By Gender
| Coverage | 2020 | 2021 | 2022 | 2023 | 2024 | ||
|---|---|---|---|---|---|---|---|
| Childcare leave take-up | Male | Five main group companies | 12 | 26 | 35 | 44 | 40 |
| Female | Five main group companies | 58 | 72 | 70 | 66 | 65 | |
| Total | Five main group companies | 70 | 98 | 105 | 110 | 105 | |
-
*The five main group companies are: KOKUYO Co., Ltd., Kaunet Co., Ltd., KOKUYO Marketing Co., Ltd., KOKUYO Supply Logistics Co., Ltd., and KOKUYO Logitem Co., Ltd.
Number of Employees on Long-Term-Care Leave: By Gender
| Coverage | 2020 | 2021 | 2022 | 2023 | 2024 | ||
|---|---|---|---|---|---|---|---|
| Long-term-care leave take-up | Male | Five main group companies | 1 | 0 | 0 | 0 | 0 |
| Female | Five main group companies | 1 | 1 | 0 | 1 | 2 | |
| Total | Five main group companies | 2 | 1 | 0 | 1 | 2 | |
-
*The five main group companies are: KOKUYO Co., Ltd., Kaunet Co., Ltd., KOKUYO Marketing Co., Ltd., KOKUYO Supply Logistics Co., Ltd., and KOKUYO Logitem Co., Ltd.
Gender Difference in Worker Pay (%)
| 2023 | 2024 | ||
|---|---|---|---|
| KOKUYO | All employees | 74.0 | 74.7 |
| Permanent employees | 75.6 | 76.2 | |
| Non-permanent employees | 68.7 | 68.9 | |
| Kaunet Co., Ltd. | All employees | 71.7 | 76.3 |
| Permanent employees | 71.2 | 75.0 | |
| Non-permanent employees | - | 244.1 | |
| KOKUYO Marketing Co., Ltd. | All employees | 66.9 | 68.9 |
| Permanent employees | 68.5 | 71.0 | |
| Non-permanent employees | 34.6 | 35.0 | |
| KOKUYO Supply Logistics Co., Ltd. | All employees | 50.8 | 54.6 |
| Permanent employees | 71.6 | 65.8 | |
| Non-permanent employees | 65.6 | 77.9 | |
| KOKUYO Logitem Co., Ltd. | All employees | 74.3 | 78.3 |
| Permanent employees | 82.4 | 86.1 | |
| Non-permanent employees | 62.8 | 64.8 | |
| KOKUYO & Partners Co., Ltd. | All employees | 52.8 | 61.7 |
| Permanent employees | 77.9 | 81.8 | |
| Non-permanent employees | 63.0 | 108.2 | |
| Actus Co., Ltd. | All employees | 67.4 | 70.3 |
| Permanent employees | 81.1 | 83.1 | |
| Non-permanent employees | 65.9 | 69.0 | |
-
Note:The gender gap in worker pay is largely attributable to differences in years of service, percentage who occupy a managerial position, and use of employee benefits. Under our Talent Management Policy, we take action to encourage employees to develop professionally and excel regardless of gender. Through such action, we are narrowing the gender gap in pay.
Health Management
| Coverage | 2020 | 2021 | 2022 | 2023 | 2024 | |
|---|---|---|---|---|---|---|
| Regular health checkup attendance rate (%) | ー | 98.6 | 99.4 | 99.6 | 99.5 | 99.7 |
| Voluntary checkup attendance number (breast cancer, colorectal cancer checkups) |
ー | 1,551 | 3,482 | 4,871 | 5,226 | 5,259 |
| Regular health checkup finding rate (%) | ー | 19.8 | 29.5 | 29.0 | 19.6 | 37.8 |
| Percentage of employees receiving full medical checkup (%) | ー | 70.5 | 75.8 | 78.0 | ー | ー |
| Lifestyle-related disease occurrence/specific health checkup attendance rate (%) | ー | 98 | 98 | 98 | 98 | 99 |
| Lifestyle-related disease occurrence/specific health guidance rate (proactive support) (%) |
ー | 39 | 47 | 42 | 46 | 54 |
| Lifestyle-related disease occurrence/lifestyle-related disease medical costs (including health insurance dependents) (million yen) |
ー | 161 | 144 | 149 | 142 | 157 |
| Response rate for stress check survey (%) | Employees of companies that conduct a stress check survey | 96.4 | 95.9 | 94.1 | 95.6 | 94.3 |
| Stress check score (deviation value) *1 | Employees of companies that conduct a stress check survey | 55 | 54 | 49 | 55 | 56 |
| Percentage of employees with poor mental health (with severe stress) (%) *1 |
Employees of companies that conduct a stress check survey | 4.8 | 5.6 | 9.3 | 11.9 | 12.3 |
| Number of employees who took leave due to poor mental health | *5 | 16 | 10 | 16 | 25 | 11 |
| Number of employees who took leave due to other illnesses | *5 | 9 | 2 | 5 | 6 | 2 |
| Number of employees who retired due to poor mental health | *5 | 10 | 1 | 5 | 3 | 3 |
| Number of employees who left due to other health issues | *5 | 6 | 8 | 2 | 7 | 2 |
| Absenteeism: Annual working days per employee lost due to injury or disease*2 | KOKUYO, Kaunet | 2.27 | 1.38 | 1.09 | 1.57 | 1.08 |
| Presenteeism: Score for productivity lost because of illness, injury, or other conditions in employees attending work (points)*3 |
KOKUYO, Kaunet | ー | ー | 21 | 21.5 | 21.7 |
| Employee engagement score (deviation value)*4 | Employees of companies that conduct a stress check survey | 49 | 50 | 51 | 51 | 53 |
| Percentage of participants in health activity (walking campaign) (%) |
KOKUYO, Kaunet | 25.3 | ー | 33 | 30.5 | ー |
| Smoking rate(%) | KOKUYO, Kaunet | ー | ー | 17.2 | 17.4 | ー |
-
*1The vendor estimation method was changed in 2023.
-
*2Absenteeism is calculated as follows: Annual absent days resulting from injury or disease divided by total working days for all employees.
-
*3The presenteeism score represents the difference between maximum productivity (scaled at 100) and employees’ actual productivity rate (according to survey findings).
-
*4The employee engagement score describes the extent to which employees identify with and actively commit themselves to the organization’s strategy and goals.
Occupational Health and Safety
Coverage: KOKUYO Co., Ltd. (excluding plant staff, including worksite staff and partner employees)
| Coverage | 2020 | 2021 | 2022 | 2023 | 2024 | |
|---|---|---|---|---|---|---|
| Work-related fatalities | KOKUYO | 0 | 0 | 0 | 0 | 0 |
| Work-related injuries or hospitalizations | KOKUYO | 1 | 1 | 2 | 4 | 4 |
Coverage: KOKUYO Co., Ltd. Mie Plant and Shibayama Plant, KOKUYO Product Shiga Co., Ltd., KOKUYO MVP Co., Ltd., IWAMI Paper Industry Co., Ltd., Origin Co., Ltd.
| 2020 | 2021 | 2022 | 2023 | 2024 | ||
|---|---|---|---|---|---|---|
| Number of work-related accidents | Consolidated plants | 5 | 1 | 6 | 6 | 4 |
| Mie Plant | 0 | 0 | 0 | 2 | 1 | |
| Shibayama Plant | 0 | 0 | 1 | 3 | 2 | |
| KOKUYO Product Shiga Co., Ltd. | 0 | 0 | 0 | 0 | 0 | |
| KOKUYO MVP Co., Ltd. | 3 | 1 | 5 | 0 | 0 | |
| IWAMI Paper Industry Co., Ltd. | 1 | 0 | 0 | 1 | 0 | |
| Origin Co., Ltd. | ー | ー | ー | ー | 1 | |
| Work-related accident frequency rate (%)*1 | Consolidated plants | 2.33 | 0.44 | 2.61 | 2.69 | 1.68 |
| Mie Plant | 0 | 0 | 0 | 3.04 | 1.72 | |
| Shibayama Plant | 0.02 | 0 | 1.43 | 4.53 | 2.83 | |
| KOKUYO Product Shiga Co., Ltd. | 0 | 0 | 0 | 0 | 0 | |
| KOKUYO MVP Co., Ltd. | 6.79 | 2.14 | 11.19 | 0 | 0 | |
| IWAMI Paper Industry Co., Ltd. | 6.67 | 0 | 0 | 7.78 | 0 | |
| Origin Co., Ltd. | ー | ー | ー | ー | 4.4 | |
| Severity rate for work-related accidents (%)*2*3 | Consolidated plants | 0.02 | 0 | 0 | 0.07 | 0.01 |
| Mie Plant | 0 | 0 | 0 | 0.04 | 0.04 | |
| Shibayama Plant | 1.83 | 0 | 0 | 0.10 | 0.01 | |
| KOKUYO Product Shiga Co., Ltd. | 0 | 0 | 0 | 0 | 0 | |
| KOKUYO MVP Co., Ltd. | 0.09 | 0.01 | 0.00 | 0 | 0 | |
| IWAMI Paper Industry Co., Ltd. | 0.03 | 0 | 0 | 0.49 | 0 | |
| Origin Co., Ltd. | ー | ー | ー | ー | 0.01 | |
| Workdays lost due to work-related accidents | Consolidated plants | 63.5 | 8 | 32 | 192 | 38 |
| Mie Plant | 0 | 0 | 0 | 34 | 30 | |
| Shibayama Plant | 12 | 0 | 26 | 82 | 6 | |
| KOKUYO Product Shiga Co., Ltd. | 0 | 0 | 0 | 0 | 0 | |
| KOKUYO MVP Co., Ltd. | 46.5 | 8 | 6 | 0 | 0 | |
| IWAMI Paper Industry Co., Ltd. | 5 | 0 | 0 | 77 | 0 | |
| Origin Co., Ltd. | ー | ー | ー | ー | 2 |
-
*For years 2016 and later, “number of work-related accidents” includes only accidents (other than those employees suffered when commuting) that resulted in at least one full workday of leave. For 2014 and 2015, it also includes accidents that did not result in such.
-
*1Work-related accident rate is calculated as follows:Number of employees who experienced a work-related accidentTotal person-hours × 1,000,000
-
*2Work-related accident severity rate is calculated as follows:Number of lost workdaysTotal person-hours × 1,000,000
-
*3The work-related accident rate is shown with the third decimal place rounded off.
A score of “0” indicates that absolutely no fatal work-related accidents occurred.
On the other hand, a score of “0.00” would indicate a fatality rate higher than 0 but less than 0.005.