ENVIRONMENT
CLIMATE CHANGE: ACTIONS
- Near-term Targets Validated by SBTi
- Calculating Our GHG Emissions Volume
- Roadmap to 2050 Target for CO2 Reduction
- GHG Emissions Reduction
- Product CO2 Visualization
SBTi Certification for Our Greenhouse Gas Emissions Reduction Targets
We recognize climate change as a vital management issue. We have positioned “Respond to the climate crisis” as one of our material issues and are working to reduce our greenhouse gas emissions (Scopes 1 and 2 (*1)).
The Science Based Targets initiative (SBTi)(*2) evaluated our GHG reduction targets on the road to our 2050 carbon neutrality goal and validated them as science-based near-term targets.
- Reduce total scope 1 and scope 2 greenhouse gas (*3) emissions by 42% between 2022 and 2030
- Reduce greenhouse gas emissions from the scope 3 (*1) category “purchased goods and services” by 25% between 2022 and 2030
- Have suppliers, responsible for 12.5% of our emissions from “purchased goods and services,” set Science-Based Targets initiative (SBTi) goals by 2028
We will expand the coverage of our scope 3 reporting and work with our suppliers to support the carbon transition.
-
*1
- ・Scope 1 Direct GHG emissions from operations that are owned or controlled by the reporting company (e.g. emissions from the combustion of fuels by the reporting company)
- ・Scope 2 Indirect GHG emissions associated with the generation of purchased electricity, steam, or heating consumed by the reporting company
- ・Scope 3 Indirect GHG emissions other than those in scope 2 that occur in the value chain of the reporting company
-
*2Science Based Targets initiative (SBTi)
The SBTi is an international initiative formed in 2015 as a collaboration between four global NGOs: the CDP, the United Nations Global Compact, the World Resources Institute (WRI), and the World Wide Fund for Nature (WWF). It calls on companies to adopt science-based targets for GHG emissions reduction as way of achieving the goals of the Paris Agreement. -
*3GHG stands for greenhouse gases.
Calculating Our GHG Emissions Volume
Calculating GHG Emissions Volume for 31 KOKUYO Group Companies
We are expanding inclusion in the calculation of GHG emissions volume through our business activities as necessary for reducing emissions in our supply chain.
In 2024, we disclosed the estimated emissions of 31 consolidated subsidiaries (including four newly consolidated that year).
Please see the Sustainability Databank on our website for emissions volumes.
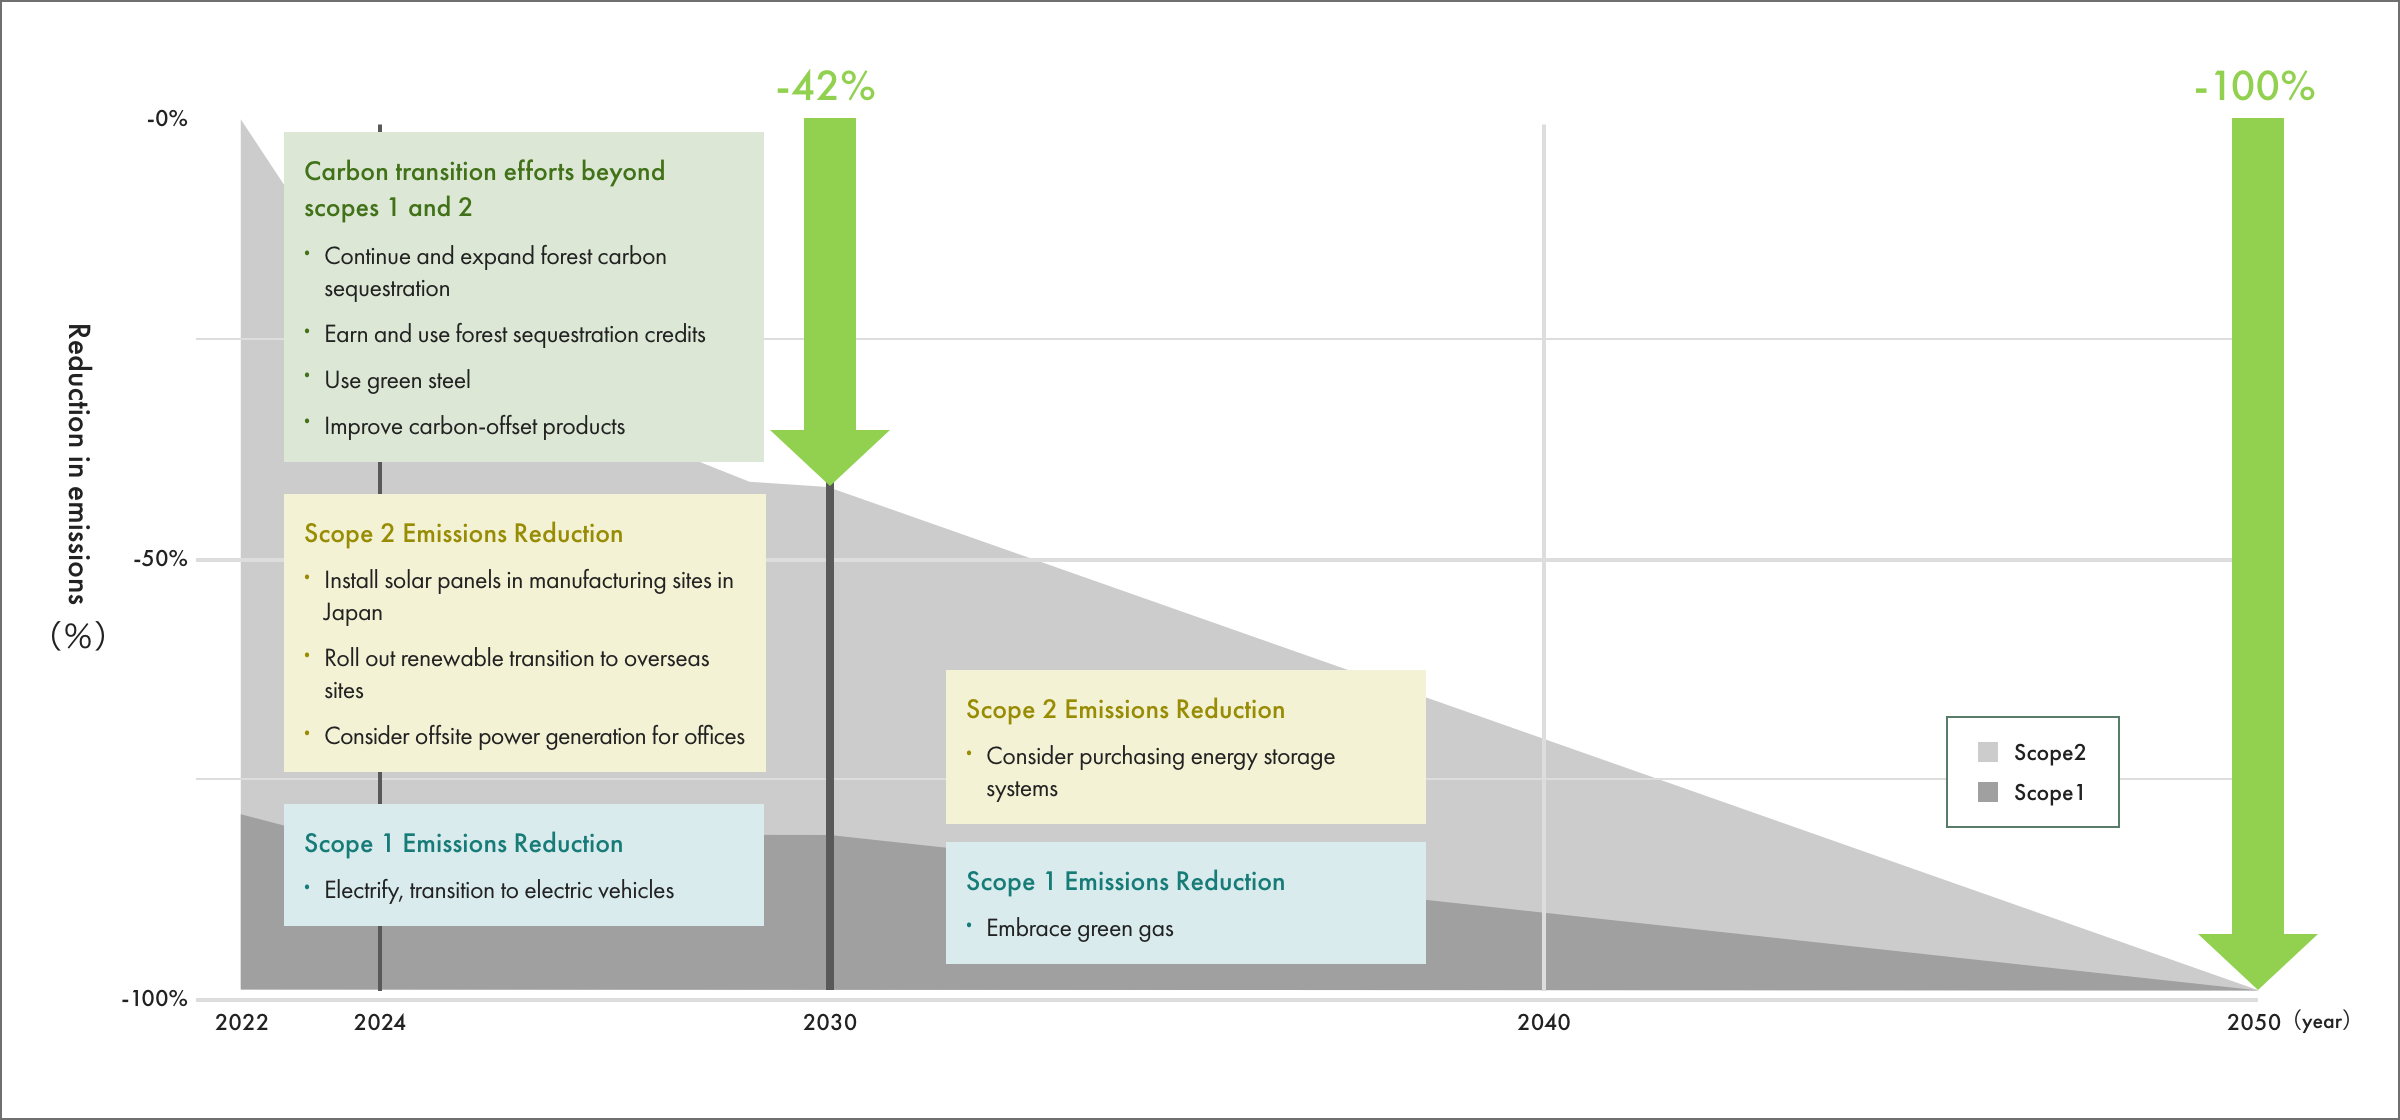
Creating a Roadmap to the 2050 Target for CO2 Reduction
We have created a roadmap that illustrates the amounts of GHG emissions we will need to reduce to become carbon neutral by 2050.
One way we achieve this goal is to reduce our scope 1 and 2 emissions (emissions from our own operations or energy purchases).
Reducing such emissions is not the only way we drive the carbon transition. As an organization that uses forest resources extensively, we also use forest carbon credits to offset emissions associated with such resource use.
GHG Emissions Reduction
Renewables Shift
Electric power is the major source of our scope 1 and 2 emissions. We are working to shift our supply to renewable energy sources in order to reduce our own greenhouse gas emissions within our supply chain (scopes 1 and 2). We shifted the following domestic sites to renewable energy between 2022 and 2024: the Mie Plant (which manufactures office furniture) in 2022; KOKUYO Product Shiga (which makes notebooks) in 2023; and in 2024, the Shibayama Plant (which manufactures room partitions), KOKUYO MVP’s Tottori Plant (which manufactures file binders) and The Campus (our core live office in Shinagawa, Tokyo). These efforts resulted in a 54.1% reduction in our emissions in Japan in 2024 versus the 2013 level.
Overseas, in India we installed solar power plants at KOKUYO Camlin’s Tarapur and Patalganga plants. Patalganga’s solar energy system was enlarged in 2024. Thanks to these efforts, by 2024, as much as 39% of the energy consumed across KOKUYO Group (which includes overseas businesses) came from non-fossil fuel energy sources.
- 2024 commitment goal, result
- Sources of scope 1 and 2 emissions
- Electric Power Consumption, Non-Fossil Fuel Weighting
Energy Saving
We are working to improve our energy efficiency alongside the transition to renewable energy sources. Energy intensity per unit of sales shows how much power we consume for every unit of sales value. This has continued to improve from a 2022 peak.
Energy Intensity per Unit of Sales
We had anticipated that plants would use more energy with the rise in production, but we managed to reduce energy use by improving operations and upgrading production equipment.
| Company | Base | % reduction |
|---|---|---|
| KOKUYO (Malaysia) | Malaysia Plant | -2.2% |
| KOKUYO Supply Logistics Co., Ltd. | Osaka Nanko Distribution Center | -3.8% |
| Ibaraki Distribution Center | -3.8% | |
| Chubu Internet Data Center | -3.1% |

KOKUYO Marketing has achieved a sharp reduction in power consumption at many of its 22 offices throughout Japan by insisting that air-conditioning is set at an appropriate temperature, improving working practices through having its staff leave the office on time and utilizing co-working spaces, and implementing a turn-down-the-lights campaign. This success is backed by the provision of environmental education to its staff. The company raised environmental-consciousness among its employees through initiatives such as annual e-learning and the disclosure of each individual office’s energy consumption.
| Company | Base | % reduction |
|---|---|---|
| KOKUYO Marketing Co., Ltd. | Tachikawa Office | -21.0% |
| Nagano Office | -11.3% | |
| Kyoto Office | -6.0% | |
| Wakayama Office | -16.7% | |
| Kumamoto Office | -5.3% | |
| Miyazaki Office | -13.8% |
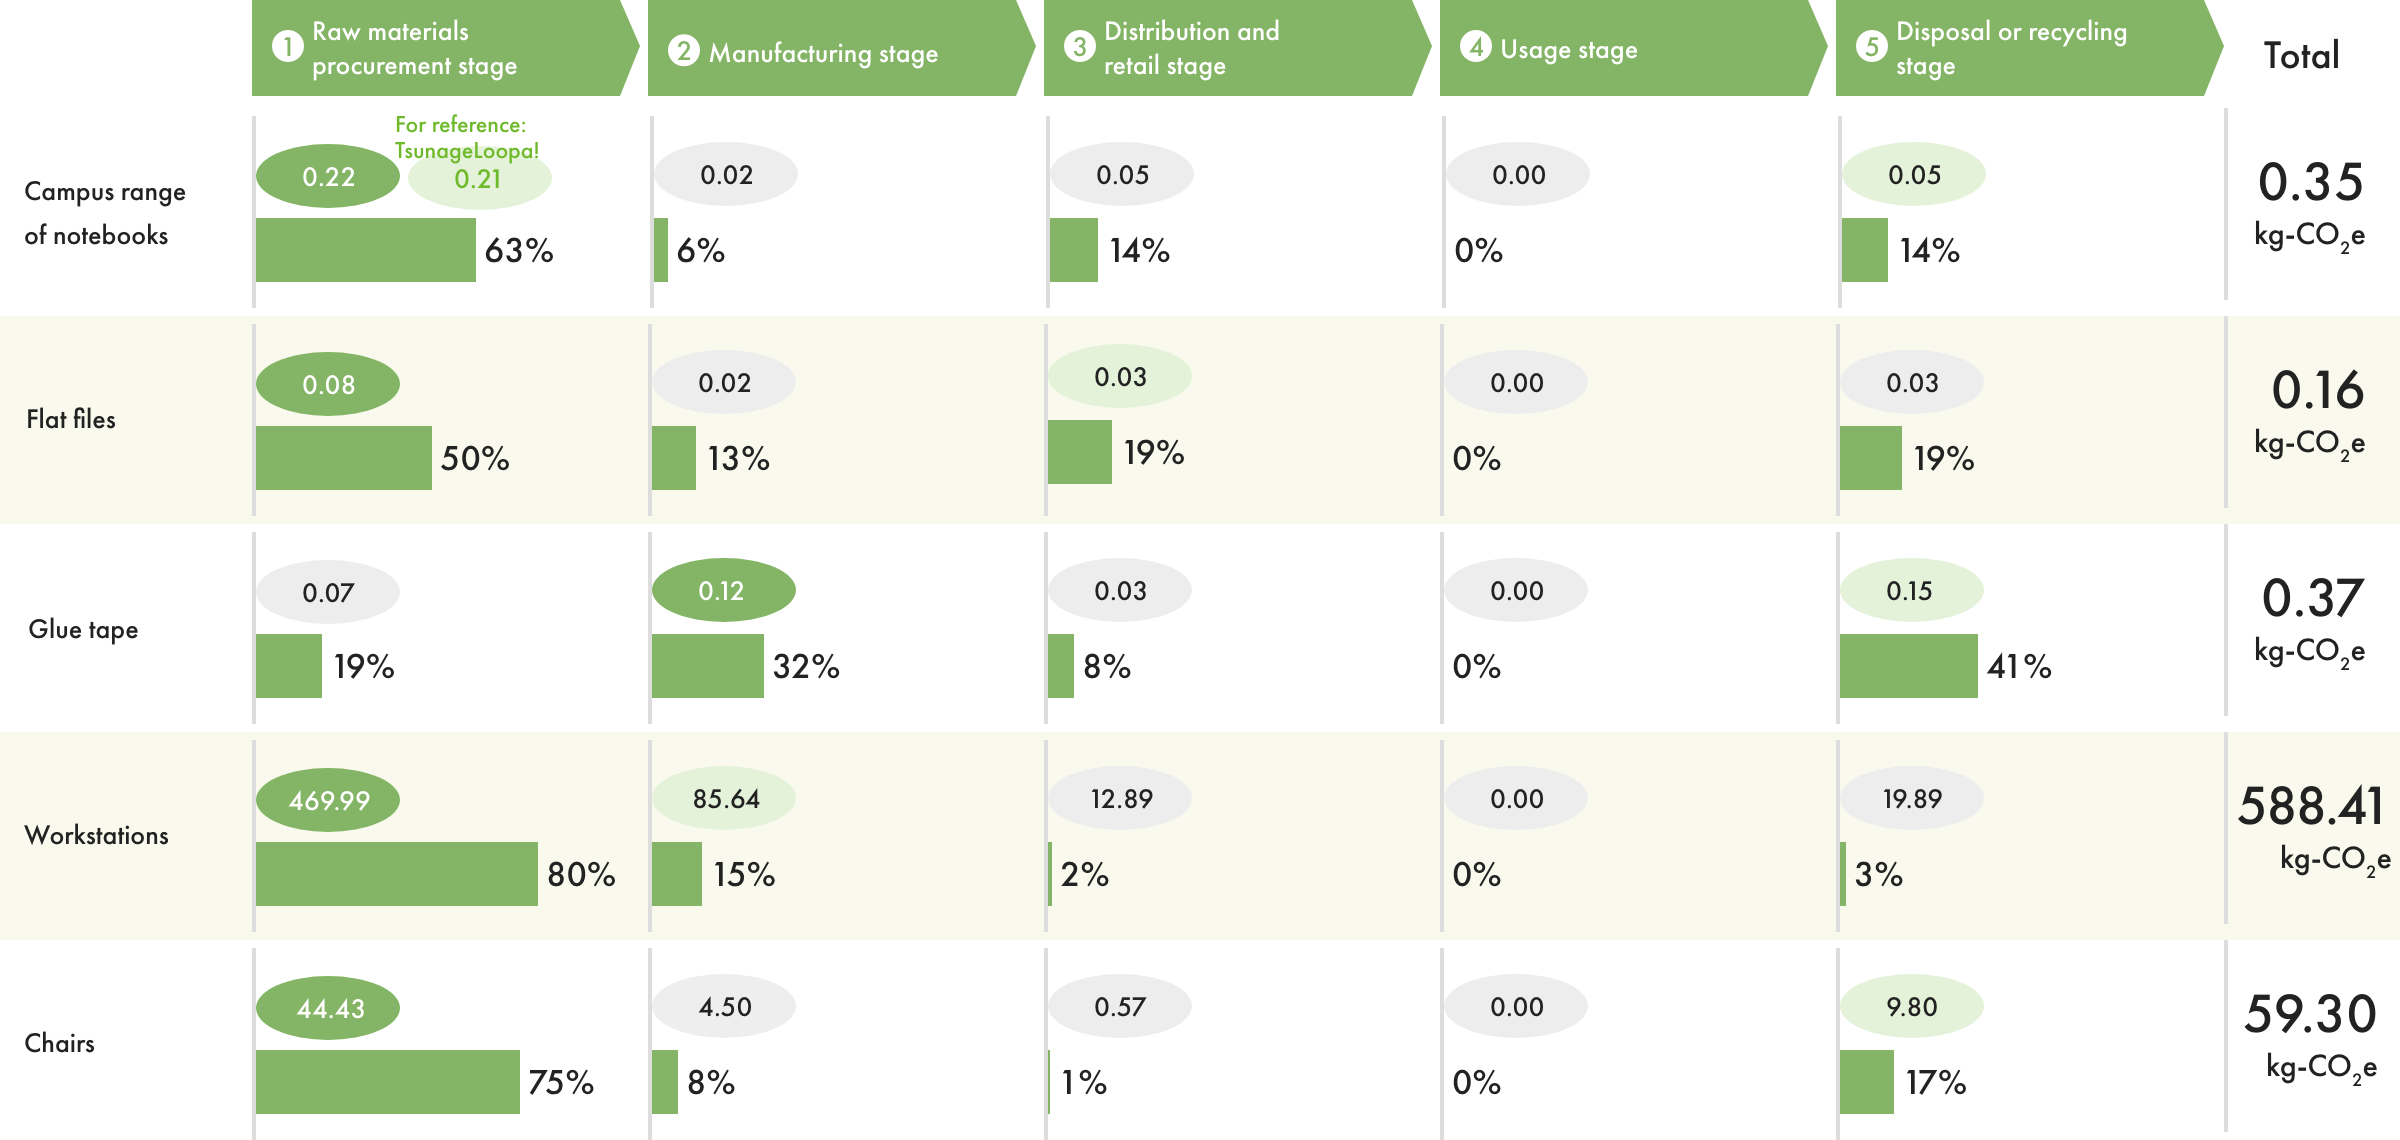
Product CO2 Visualization
For our main products, we estimate the total product carbon footprint (PCF), meaning the carbon footprint generated across the whole of the product life cycle, from the procurement or raw materials to the time of final disposal or recycling.
From 2010 to 2023, we estimated total PCF independently. However, we now adopt follow industry standards in our calculations. For stationery and office supplies, we follow the calculation rules of the All Japan Stationery Association. For office furniture, we follow the calculation rules of the Japan Office and Institutional Furniture Association. These industrial associations issued these standards in March 2024 in response to the passing of the 2023 Act on Promoting Green Purchasing, which set out requirements related to the carbon footprint of stationery and office furniture.
As well as following these industry standards, we adhere to a PCF scheme that Osaka Prefecture launched in conjunction with the 2025 Osaka Expo. The scheme encourages companies that have best practices in calculating supply chain emissions. Its purpose is to encouraging companies to generate data that visually illustrates such emissions.
The results of this calculation exercise are as follows.
Carbon Footprint Calculation for KOKUYO Products
For reference: See here for the results of the “carbon footprint system pilot program” implemented in 2010 (run by METI and related ministries and agencies).