-MATERIAL ISSUE 3- RESPOND TO THE CLIMATE CRISIS
KOKUYO Materiality Respond to the climate crisis
Basic policy
Over 90% of our emissions are from our value chain (scope 3), meaning that we can’t contribute to carbon neutrality just by reducing emissions from our own businesses.
We rely on numerous production and distribution partners. To contribute to carbon neutrality, we work with these supply chain partners on initiatives such as switching to more sustainable raw materials and delivery methods.
Implementing the basic policy: Following the TCFD framework

Governance
In 2022, we endorsed the recommendations of the Task Force on Climate-related Financial Disclosures (TCFD). We regard climate change as a major strategic concern and have established an organizational framework for managing climate-related risks. Under the supervision of the Board of Directors, the Sustainability Committee identifies climate-related risks so that the management can incorporate the information into strategic planning and take the decisions and actions necessary to mitigate the risks. To supervise this process effectively, the Board of Directors hears reports from the committee twice a year and then deliberates on climate-related risks and other sustainability issues. The board also decides on matters of strategic importance.
The Sustainability Committee’s membership consists entirely of executives and the committee is chaired by the Managing Officer of the CSV Division. The committee monitors social and environmental trends to identify strategic concerns related to sustainability. It then formulates actions plans and allocates budgetary resources for addressing these concerns. The Environment Subcommittee (a subcommittee of the Sustainability Committee) collaborates with the managers responsible for each business division to identify climate-related risks, incorporate the findings into strategic planning, and spearhead organization-wide efforts to mitigate the risks.
Strategy
We use scenario analysis to identify the climate-related risks and opportunities and their financial implications so that the necessary measures can be taken. Since 2030 is the endpoint for our long-term vision, our scenario analysis projects climate-related shifts in society and among stakeholders between now and that endpoint. The scenario analysis conducted in FY2021 covered the furniture and business supply distribution businesses, which fall under the Workstyle segment. In FY2022, it covered the stationery and interior retail businesses, which fall under the Lifestyle segment. We have identified the climate-related risks and opportunities in the stationery and interior retail businesses.
Scenario analysis
| Scenario | Description of scenario | References |
|---|---|---|
| Within 1.5℃ | Sustainable Development / Net-zero Scenarios: Committing to a net-zero transition by 2050, the world acts to keep global warming below 1.5℃ relative to pre-industrial times. Government regulation is tougher compared to that in the 4℃ scenario, and people take a greater interest than they do at present in climate change and other environmental issues. |
|
| 4℃ | Stated Policies Scenario: Government regulation is weak compared to the other two scenarios. There are no further measures or further policy intentions beyond what governments have already implemented or stated. GHG emissions may increase for a time, and people’s interest in climate change and the environment remain as it is now. |
|
Risks and opportunities
< Workstyle Field >
| Scenario | Furniture Businesses |
|---|---|
| 1.5℃ | With growing pressure around the world for a net-zero transition, our customers, suppliers, and other social stakeholders will take more action to contribute to the net-zero transition and to reduce waste. The financial/business risks include higher CO2 emissions costs, the need for more capital spending, higher raw material costs, and a decline in sales revenue following changes in customers’ needs. The opportunities include the potential for developing goods and services to cover shifting customer needs and behavior, and the potential to expand business domains by developing low-emissions businesses. Accordingly, we will seize the opportunity to develop new products and services so that we can create value suited to the changes among customers and in society. |
| 4℃ | Timber prices rise amid the global spread in consumer activism coupled with climate impacts. Manufacturing and transportation become increasingly vulnerable to climate-related disaster risks. The financial/business risks include higher raw materials costs and the risk that hiking sales prices to absorb the cost increases may cause a drop in demand for furniture products. Where physical risks materialize, the risks include opportunity losses, business suspension, and the cost of responding to the incident. We will address the risks by increasing our organization’s resilience. We also eye opportunities in the changing market trends, including the rise of disaster management efforts and new workstyles in our customers’ offices. To capture these opportunities, we will develop new solutions that create value. |
| Scenario | Business Supply Distribution |
|---|---|
| 1.5℃ | As the net-zero transition progresses, customers, distributors, and other social stakeholders take more action to contribute to the net-zero transition and to reduce waste. The financial/ business risks include the costs of carbon taxes, higher transport costs, and a decline in sales revenue following changes in customers’ needs. The opportunities include the potential to increase sales revenue with a lineup suited to the shifting customer needs. Accordingly, we will seize the opportunity to change our product lineup and expand our digital measures so that we can increase our climate resilience and create value suited to the changes among customers and in society. |
| 4℃ | Raw material prices rise amid the global spread in consumer activism coupled with climate impacts. Physical risks materialize, disrupting transportation and other parts of the supply chain, which may have severe ramifications for the business model. The financial/business risks include higher costs, both for raw materials and for transportation. Where physical risks materialize, the risks include opportunity losses, business suspension, and the cost of responding to the incident. To address the risks, we will strengthen our organization’s resilience by altering our procurement strategy and expanding digital measures. |
< Lifestyle Field >
| Scenario | Global Stationery |
|---|---|
| 1.5℃ | The global net-zero transition leads to new consumer and market trends, with consumers changing their attitudes toward stationery and other consumables and with new workstyles and learning styles emerging. The financial/business risks include higher CO2 emissions costs, higher raw material costs, the costs of added investment, and the risk that the stationery market shrinks amid digitalization. The financial/business opportunities include the chance to create new value by developing products and services for Japanese and overseas markets that cater to the emerging trends. |
| 4℃ | Cost pressures increase amid the global spread in consumer activism and the physical impacts of climate change become an increasing threat. The financial/business risks include higher costs in raw materials and energy. Where physical risks materialize, the risks include opportunity losses and the cost of responding to the incident. Financial/business opportunities include a growing demand for stationery in overseas markets. The opportunities can be realized by strengthening resilience, globalizing the supply chain, and expanding in overseas markets. |
| Scenario | Interior retail businesses |
|---|---|
| 1.5℃ | The net-zero transition increases pressure to realize ecological sustainability, including reducing the CO2 emissions generated in the life cycle of furniture (from production to disposal). The financial/business risks include higher CO2 emissions costs, higher raw material costs, and the costs of added investment. They also include the risk that people purchase interior goods less frequently out of concern for the environment and the risk of increased competition from furniture rental and subscription services. Financial/business opportunities can be realized by balancing business interests with environmental friendliness, such as by carbon footprint labeling and developing services that reduce furniture waste (e.g. repair services). |
| 4℃ | Prices for timber goods and other products rise amid the global spread in consumer activism coupled with climate impacts. The supply chain and retail activities become increasingly vulnerable to climate-related disaster risk. The financial/business risks include higher raw materials costs and the risk that hiking sales prices to absorb the cost increases may cause a drop in demand for furniture products. Where physical risks materialize, the risks include opportunity losses and the cost of responding to the incident. To manage these risks, we will strengthen resilience and ensure stable deliveries of our products by altering our procurement strategy and developing our e-commerce business. |
Risk Management
Climate-related risks are managed by the Environment Subcommittee (a subcommittee of the Sustainability Committee). Guided by the findings of regular internal and third-party research, this subcommittee identifies and evaluates the risks with attendance of managers responsible for each business division. Once the risks are identified and evaluated, they are communicated to business divisions concerned. The strategic implications of the risks are incorporated into strategic planning by the Environment Subcommittee, while business-specific implications are addressed by the relevant business divisions. Under the existing system for groupwide risk management, the Risk Management Committee has steered efforts across the corporate group to manage groupwide risks.
To integrate climate-related risk management into this existing system for groupwide risk management, the Risk Management Committee will now coordinate with the Sustainability Committee’s Environment Subcommittee. Specifically, the Environment Subcommittee will inform the Risk Management Committee about important matters concerning risk management and the state of compliance with environmental laws and regulations.
Metrics and Targets
Material issues
| Outcome | 2030 challenge goal | 2024 commitment goal | |
|---|---|---|---|
| KPI | |||
| Our collaboration with partners contributes toward carbon neutrality throughout our supply chains. | With our partners support, we have achieved our carbon emissions reductions target based on the Science Based Targets initiative (SBTi) | SBTi-based emissions reduction target: Target set and achieved (target to be determined) | Emissions reductions target: 50% reduction in our Japanese businesses from 2013 level |
| Carbon sequestration: At least 6,000 t-CO2 sequestered a year | |||
We have committed to reaching net-zero by 2050.
We have previously worked to reduce GHG emissions at scopes 1 and 2, focusing on the emissions caused by our business activities in Japan. We have now expanded our focus to scope 3 emissions—emissions in the supply chain related to business activities across the Kokuyo Group.
For 2030, we have set a GHG reduction target representing a milestone on the road to 2050. The target aligns with the Science Based Targets initiative (SBTi) established in the Paris Agreement.
We have also committed to a 2024 target of 50% reduction from the 2013 level in GHG emissions from operations in Japan.
Accomplishments in 2023, plans for 2024
| Accomplishments in 2023 | Plans for 2024 |
|---|---|
|
2024 commitment goal
2030 challenge goal
|
2024 commitment goal
2030 challenge goal
|
Submitting science-based targets (for 2030) for validation
We have embarked on our journey to reach carbon neutrality by 2050.
We have set near-term science-based targets aligned with the criteria set by the Paris Agreement and submitted the targets to the SBTi for validation. They include targets pertaining to scope 3 (supply chain) emission, so we will work with our supply-chain partners to make our supply chain carbon neutral.
Targets submitted to SBTi (they are still undergoing review as of May 2024)
- Reduce total GHG emissions at scopes 1 and 2 by 42% between 2022 and 2030
- Reduce total GHG emissions at the scope 3 category “purchased goods and services” by 25% between 2022 and 2030
- Get suppliers representing 17.4% of GHG emissions from “purchased goods and services” to commit to SBTis by 2028
From now on, we will focus on supply chain emissions as well as emissions from our own operations.
Strategy to meet 2024 commitment target
Progress in 2023 toward 2024 target
We have committed to a reduction of 50% from the 2013 level in GHG emissions at scopes 1 and 2 in Japanese operations.
In 2023 and earlier, we worked to meet this goal by shifting to renewable energy sources in Kokuyo Mie plant (which produces office furniture) and Kokuyo Product Shiga (which produces notebooks and other paper products). These renewables shift reduced CO2 emissions by 38.9%.
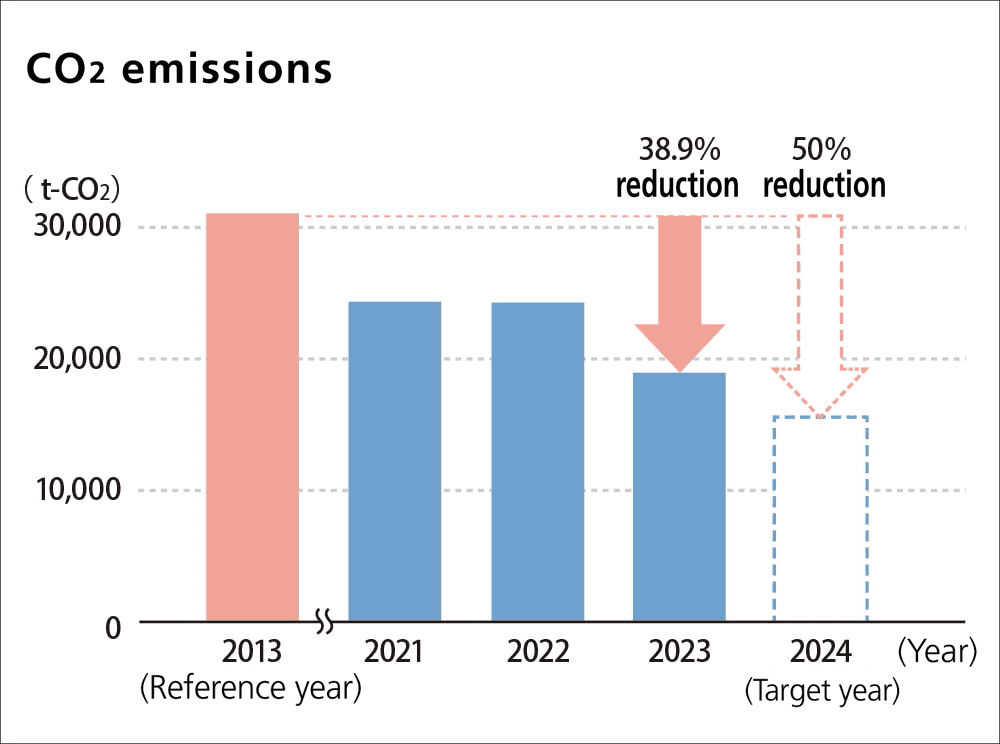
- CO2 reduction result: 38.9% down from 2013 level
Coverage: Consolidated subsidiaries in Japan, Kokuyo K Heart, Heartland - CO2 absorption: 4,133t-CO2
Certificate validating CO2 absorption in Yui-no-Mori in July 2022
| 2013 (reference year) |
2021 | 2022 | 2023 | 2024 (goal) |
|
|---|---|---|---|---|---|
| CO2 emissions (t-CO2) |
30,683 | 24,103 | 24,101 | 18,741 | 15,341 |
| % change | -21.4% | -21.5% | -38.9% | -50.0% |
Strategy to meet 2024 goal
We are reducing CO2 emissions originating from the generation and consumption of electricity, which account for the majority of our scope 1 and 2 emissions. Kokuyo Mie plant (which produces office furniture) switched to net-CO2-free power in 2022, and Kokuyo Product Shiga (which produces notebooks) did so in 2023.
In 2024, the switch will be made in Shibayama plant (which produces room partitions), in Kokuyo MVP’s Tottori plant, and in The Campus (our core live office in Shinagawa).
GHG levels: Calculation, reduction initiatives
Scopes 1 and 2 (our own emissions)
CO2 emissions from 29 entities (Japan and overseas) in the Kokuyo Group
To meet the criteria for SBT validation, we expanded the coverage of reduction estimates to our consolidated subsidiaries.
Our estimates encompass 29 entities: Kokuyo, 26 consolidated subsidiaries, and two affiliates.
In 2022, these entities emitted 37,846 tons of CO2. In 2023, this was down to 32,869 tons as a result of switching to renewable energy sources.
- The 2030 target pertains to the entities that were included in the scope of consolidation in the reference year of 2022.
- See the Data section for reduction results that include entities added to the scope of consolidation in or after 2023 and entities that are outside the scope of consolidation (non-consolidated subsidiaries and affiliates).
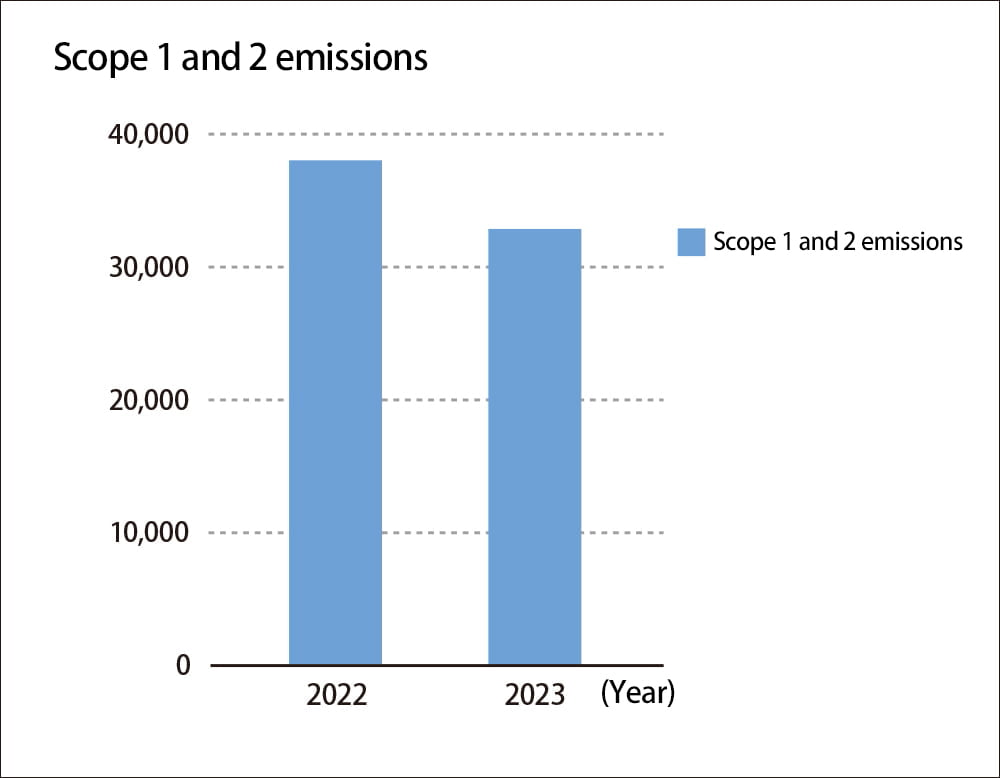
| Scope 1 and 2 emissions | |
|---|---|
| 2022 | 37,846 |
| 2023 | 32,869 |
Renewables shift
We are switching to renewable energy sources to reduce our scope 1 and 2 emissions.
Kokuyo Mie plant (which produces office furniture) switched to net-CO2-free power in 2022, and Kokuyo Product Shiga (which produces notebooks) did so in 2023. In 2024, the switch will be made in Shibayama plant (which produces room partitions), in Kokuyo MVP’s Tottori plant, and in The Campus (our core live office in Shinagawa).
-
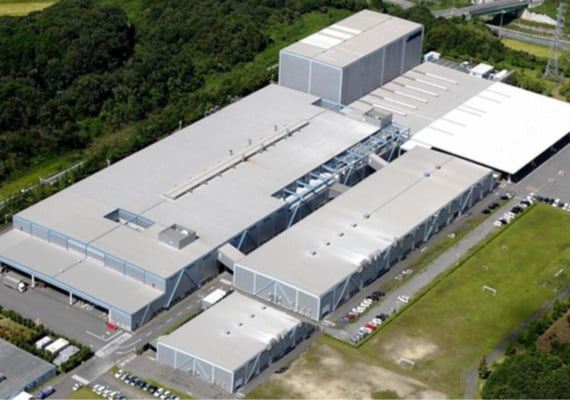
Kokuyo Mie Factory
-
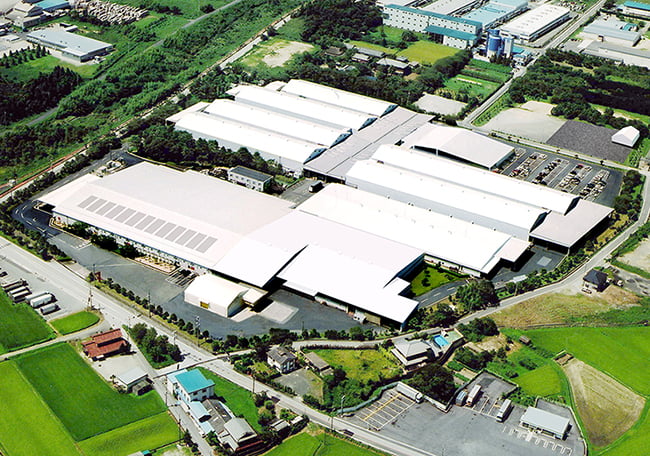
Kokuyo Product Shiga
Energy saving
While shifting to renewables, we are also working to use energy more efficiently in an ongoing effort to reduce energy consumption and GHG emissions.
Offices
With the post-pandemic return to offices, we have seen a rise in office energy use. To offset this, we are working to make our office assets more energy-efficient. We upgraded the air conditioning at our Osaka workshop, reducing energy use by 24%.
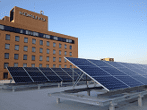
Solar panels installed on the new wing of the Osaka office
Plants
We had anticipated that plants would use more energy with the rise in production, but we managed to reduce energy use by improving operations and upgrading production equipment.
At Mie plant (which produces office furniture), operational improvements improved production efficiency, resulting in 8% less energy use. At Kokuyo Product Shiga (which produces notebooks), a change in the rules for ventilation resulted in 9% less energy use.
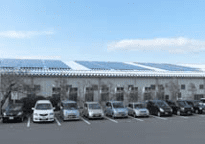
Solar panels at Shiga plant
Distribution in Japan (warehousing, deliveries)
With stronger commitment to energy efficiency (more energy-efficient lighting practices, for example), KOKUYO Logitem reduced energy use by 6% in deliveries in its distribution center for the Greater Tokyo Area and by 15% in deliveries in its distribution center for Chiba.
Hybrid streetlights installed at our integrated distribution center for the Greater Tokyo Area
Scope 3 (supplier emissions)
Committed to decarbonizing our supply chain, we estimate and disclose scope 3 emissions (such as emissions from manufacturing services, transport and distribution, or from the use and end-of-life treatment of sold products).
Previously, we limited our calculations to operations related to Kokuyo-brand products that Kokuyo produces. Starting in 2022, we expanded the coverage to include consolidated subsidiaries so that we could ascertain the environmental impacts of operations across our supply chain.
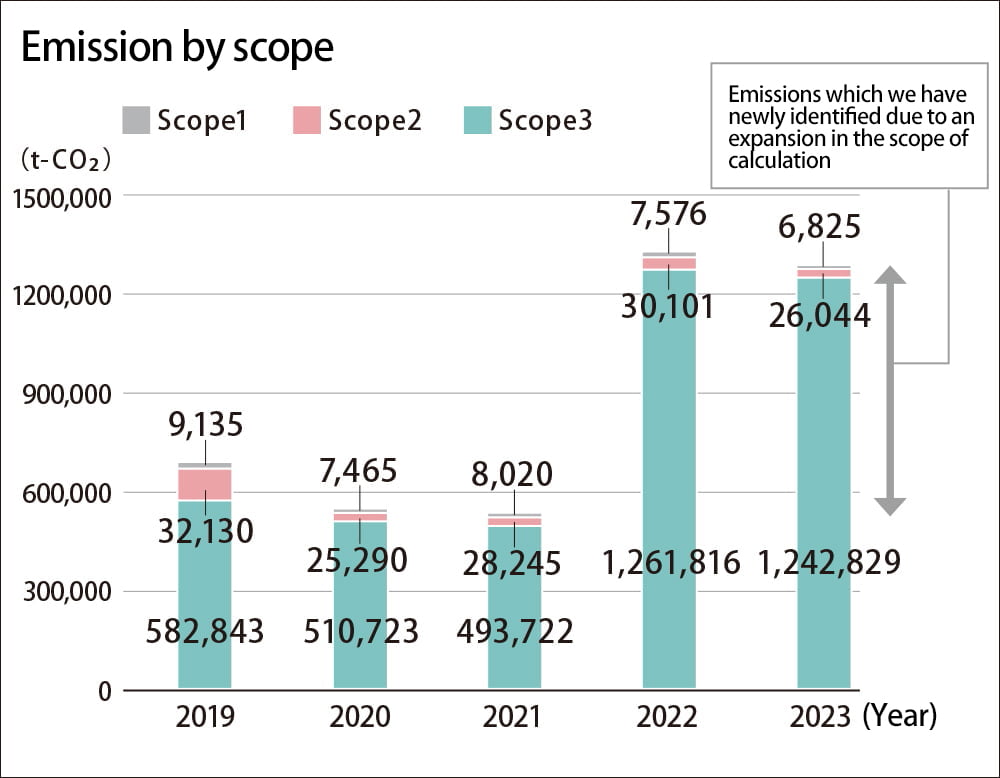
With this wider scope, total GHG emissions in 2023 amounted to 1,275,697 tons, down from the 2022 figure of 1,299,493 tons. A major contributor was the reduction in scope 2 emissions with the shift to renewables in our Japanese production sites.
We will continue our efforts to reduce our value chain emissions.
The reliability of our environmental data was confirmed in an independent assessment conducted by Bureau Veritas Japan.
- In 2022, we expanded the coverage to include consolidated subsidiaries.
- We noticed an error in the data for 2022 that we disclosed in 2023. The graph above shows the corrected data.
| 2023 | Emission by scope (t-CO2) | % of total |
|---|---|---|
| Scope1 | 6,825 | 0.5% |
| Scope2 | 26,044 | 2.0% |
| Scope3 | 1,242,829 | 97.4% |
| Total | 1,275,697 |
| 2019 | 2020 | 2021 | 2022 | 2023 | |
|---|---|---|---|---|---|
| Scope1 | 9,135 | 7,465 | 8,020 | 7,576 | 6,825 |
| Scope2 | 32,130 | 25,290 | 28,245 | 30,101 | 26,044 |
| Scope3 | 582,843 | 510,723 | 493,722 | 1,261,816 | 1,242,829 |
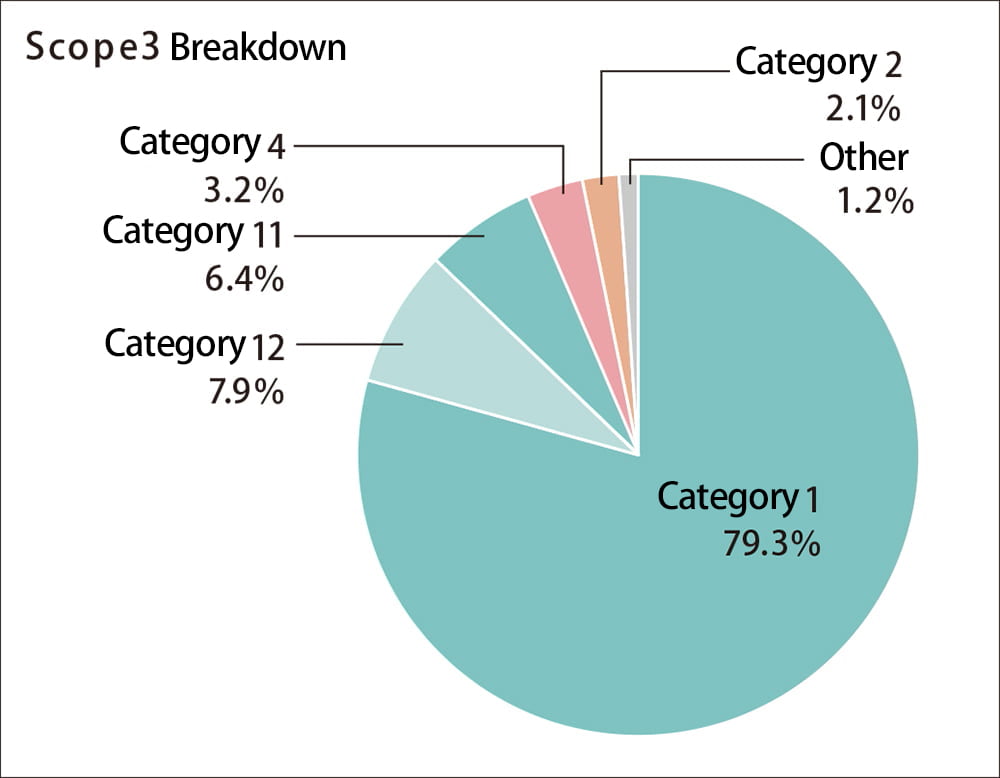
| Category | Are these emissions calculated? | Reason for not calculating | Scope 3 emissions (t-CO2) | % of scope 3 emissions | % of total emissions (scopes 1, 2, & 3) | |
|---|---|---|---|---|---|---|
| Category 1 | Purchased goods and services | Yes | - | 985,083 | 79.3% | 77.2% |
| Category 2 | Capital goods | Yes | - | 25,715 | 2.1% | 2.0% |
| Category 3 | Fuel- and energy-related activities not included in scope 1 or 2 Fuel- and energy-related activities |
Yes | - | 5,696 | 0.5% | 0.4% |
| Category 4 | Upstream transportation and distribution | Yes | - | 40,052 | 3.2% | 3.1% |
| Category 5 | Waste generated in operations | Yes | - | 4,055 | 0.3% | 0.3% |
| Category 6 | Business travel | Yes | - | 1,187 | 0.1% | 0.1% |
| Category 7 | Employee commuting | Yes | - | 3,129 | 0.3% | 0.2% |
| Category 8 | Upstream leased assets | No | Because we calculate them as scope 1 and 2 emissions | - | 0.0% | 0.0% |
| Category 9 | Downstream transportation and distribution | Yes | - | 5 | 0.0% | 0.0% |
| Category 10 | Processing of sold products | No | Because we produce complete products, not intermediate goods | - | 0.0% | 0.0% |
| Category 11 | Use of sold products | Yes | - | 79,250 | 6.4% | 6.2% |
| Category 12 | End-of-life treatment of sold products | Yes | - | 97,990 | 7.9% | 7.7% |
| Category 13 | Downstream leased assets | Yes | - | 284 | 0.0% | 0.0% |
| Category 14 | Franchises | Yes | - | 382 | 0.0% | 0.0% |
| Category 15 | Investments | No | Because this category does not apply | - | 0.0% | 0.0% |
| Total | - | - | - | 1,242,829 | - | - |