ENVIRONMENTAL PERFORMANCE DATA
DATABANK ENVIRONMENTAL PERFORMANCE DATA
■Reporting Period
Fiscal 2023 (January 1 to December 31, 2023)
■Guidelines Used for Reference
Ministry of the Environment, Environmental Report Guidelines (2012 Edition)
Ministry of the Environment, Environmental Accounting Guidelines (2005 Edition)
Global Reporting Initiative (GRI), Sustainability Reporting Guidelines
■Organizational Units Covered
From 2012, the scope of coverage was extended to all consolidated subsidiaries.
| Consolidated Subsidiaries | Non-consolidated Subsidiaries and Affiliates | |
|---|---|---|
| Japan | KOKUYO Co., Ltd. | KOKUYO K Heart Co., Ltd., Heartland Co., Ltd., IWAMI Paper Industry Co., Ltd., Origin Co., Ltd., ESTIC CORPORATION |
| Kaunet Co., Ltd., KOKUYO Marketing Co., Ltd., KOKUYO Supply Distribution Co., Ltd., KOKUYO Logitem Co., Ltd., KOKUYO Product Shiga Co., Ltd., KOKUYO MVP Co., Ltd., LmD International Co., Ltd., Actus Co., Ltd., KOKUYO Finance Co., Ltd, KOKUYO & Partners Co., Ltd., KOKUYO Hokkaido Sales Co., Ltd., KOKUYO Tohoku Sales Co., Ltd., KOKUYO Kitakanto Sales Co., Ltd., KOKUYO Tokai Sales Co., Ltd., KOKUYO Hokuriku-Niigata Sales Co., Ltd., KOKUYO Sanyo-Shikoku Sales Co., Ltd., KISPA Inc., NIKKAN Co., Ltd. | ||
| Overseas | KOKUYO Vietnam Co., Ltd., KOKUYO Malaysia Sdn. Bhd., KOKUYO (Shanghai) Management Co., Ltd., KOKUYO Commerce (Shanghai) Co., Ltd., KOKUYO Furniture (China) Co., Ltd., KOKUYO Design Consultants (Shanghai) Co., Ltd., KOKUYO International Asia Co., Ltd., KOKUYO International (Malaysia) Sdn Hbd, KOKUYO Vietnam TRADING Co., Ltd., KOKUYO Camlin Limited, KOKUYO Hong Kong Ltd., Global Known Ltd., Lamex China Investment Ltd., Lamex Trading Company Ltd., Dongguan Lamex Furniture Ltd., Lamex (S) Sales Pte. Ltd. | KOKUYO-IK (Thailand) Co., Ltd. |
Scope of Report: KOKUYO Co., Ltd., 34 consolidated subsidiaries, six non-consolidated subsidiaries and affiliates (192 locations)
2023 Results
| Environmental Policy | Goals and Results for 2023 | Goal met? | |
|---|---|---|---|
| Goal | Result | ||
| Prevention of global warming *Domestic consolidated subsidiaries, KOKUYO K Heart, Heartland |
Reduction of CO2 emissions Total year-on-year change in volume: -7.2% (when production is excluded: -13.0%) |
-13.5% (reduction efforts reduced emissions by -15.1%) |
Yes |
| Reduction of unit energy consumption Year-on-year reduction: -1.0% |
Per unit of sales: -13.6% | Yes | |
| Resource Conservation and Recycling | Improve recycling rate in relation to total waste volume Business offices: 95.9% and over Construction sites: 82.3% and over |
Business offices: 93.8% | No |
| Construction sites: 81.8% | No | ||
| Procurement, development, and provision of eco-friendly products | Maintain eco x zero | Maintained | Yes |
| Information disclosure and communication | Publication of CSR report 2023 | Publication of CSR report 2023 | Yes |
| Environmental management | ISO 14001: Regular inspection in 2015 | Regular inspection results Strong point: 0 cases Good points: 17 cases Matters pointed out for improvement: 0 cases Opportunities for improvement: 16 cases |
Yes |
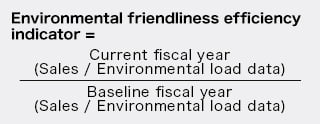
Environmental Friendliness Efficiency Indicators
KOKUYO Group designates unique environmental friendliness efficiency indicators as indices to comprehensively evaluate financial performance and impact on the global environment.
These indicators show the extent to which products and services are being offered to society with respect to specific environmental load and correspond to the following four items.
- CO2 emissions
- Final waste disposal
- Usage of chemical substances subject to PRTR regulations
- Water usage
Using fiscal 2000 as the baseline for each indicator, the progress status for each fiscal year can be determined.
Environmental Friendliness Efficiency Indicators
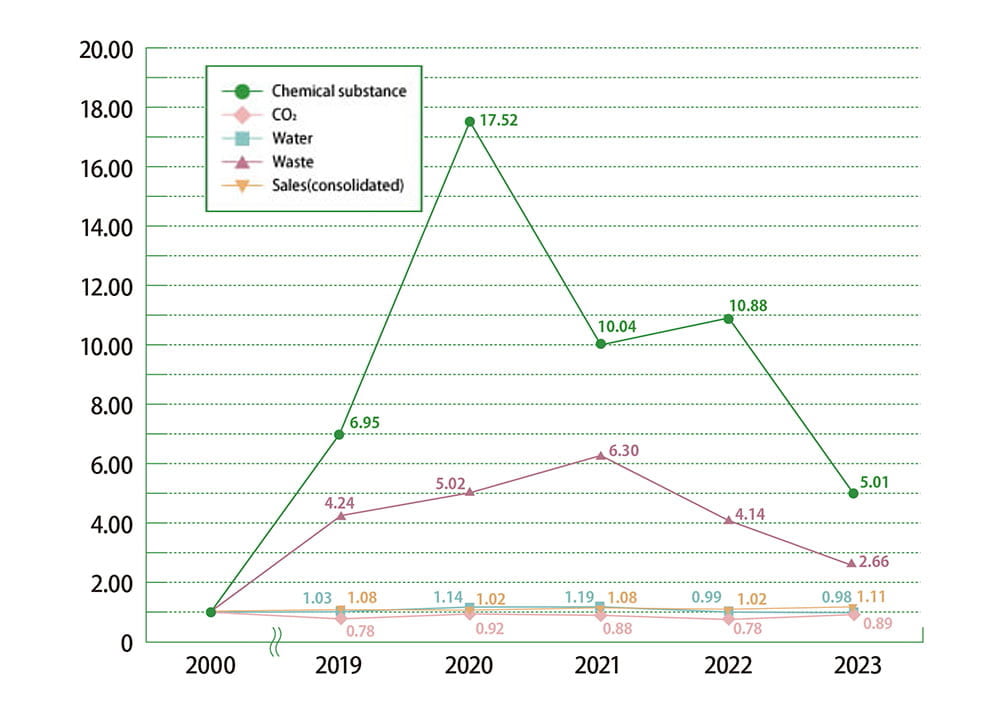
- The chemical substances have been calculated according to the volume of chemical substances designated as class 1 under the PRTR Law handled by sites (in Japan) which are required to report data under the PRTR Law.
- The actual values from April to December 2023 have been given for the volume of chemical substances handled in 2023 in response to the revision to the PRTR Law.
- CO2 (greenhouse gas emissions) from 2019 have been calculated according to the adjusted emission factor for each power company.
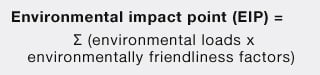
JEPIX
The Japan Environmental Policy Priorities Index (JEPIX) is a method of quantifying the individual amount of different types of environmental loads, such as greenhouse gas emissions and air pollutants, as single indicators called Environmental Impact Points (EIP). The EIP is calculated by multiplying the environmental load of each environmentally harmful chemical by the integrated coefficient, which is calculated from the ratio between Japan’s environmental policy target and the actual amount of emissions (environmental friendliness factor), and then obtaining the sum total of them all.
JEPIX
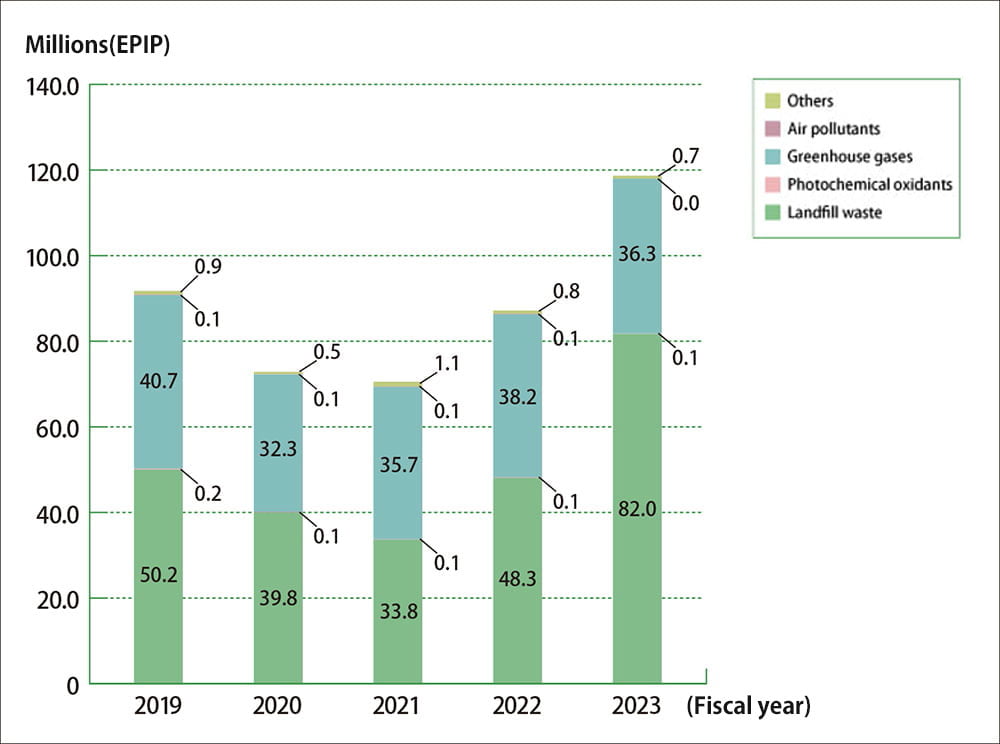
| (Millions [EIP]) | 2019 | 2020 | 2021 | 2022 | 2023 |
|---|---|---|---|---|---|
| Landfill waste | 50.2 | 39.8 | 33.8 | 48.3 | 82.0 |
| Photochemical oxidants | 0.2 | 0.1 | 0.1 | 0.1 | 0.1 |
| Greenhouse gas | 40.7 | 32.3 | 35.7 | 38.2 | 36.3 |
| Air pollutants | 0.1 | 0.1 | 0.1 | 0.1 | 0.0 |
| Other | 0.9 | 0.5 | 1.1 | 0.8 | 0.7 |
Emissions of soot and smoke (SOx and NOx)
designated by the Air Pollution Control Act
| 2021 | 2022 | 2023 | |
|---|---|---|---|
| SOx | - | - | - |
| NOx | 0.30 | 0.13 | 0.11 |
(Unit tons)
Air pollutants and photochemical oxidants for 2023 have been calculated from the actual values for chemical substances from April to December 2023 in response to the revision to the PRTR Law.
Global Warming Preventative Measures
Material Issue: Respond to the Climate Crisis
Attainment of the goal for CO2 emissions:
The domestic consolidated subsidiaries of KOKUYO K Heart and Heartland have been calculated within the applicable scope.
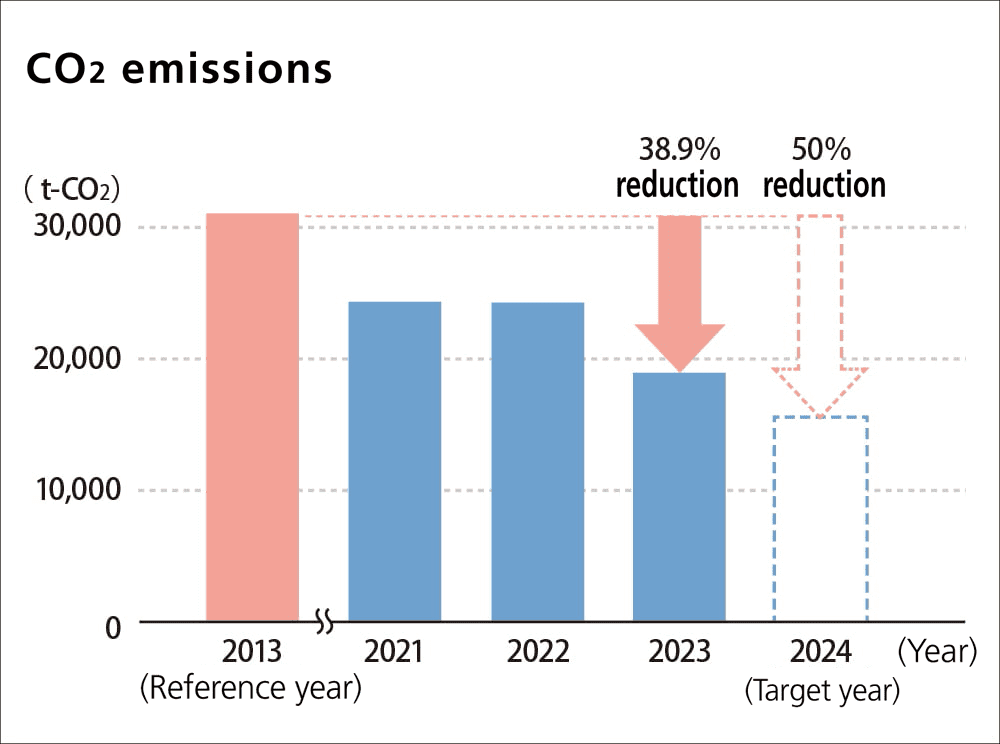
- Electricity-based emission factors are calculated using the basic emission factors of the relevant electrical power companies for each given year
- Results for 2020 and later are disclosed based on a market-based approach.
| CO2 emissions (t) | |
|---|---|
| 2013 (Base year) | 30,683 |
| 2021 | 24,103 |
| 2022 | 24,101 |
| 2023 | 18,741 |
| 2024 (Target year) | 15,341 |
(Unit tons)
Scope 1 and 2 Emissions
KOKUYO, 20 consolidated subsidiaries (domestic and overseas), 10 affiliates (domestic and overseas)
CO2 emission transitions
*KOKUYO Co., Ltd., 20 consolidated subsidiaries, 10 affiliates
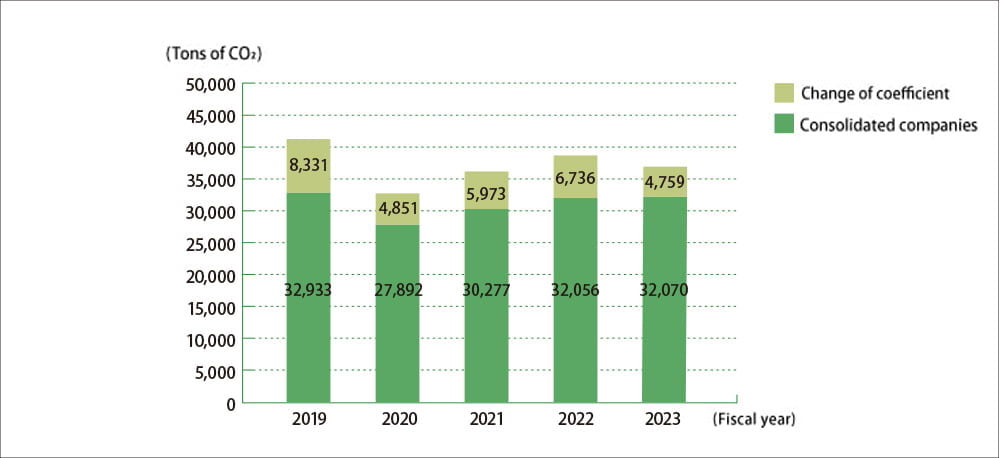
| Scope of calculation | Coefficient change | Total | |
|---|---|---|---|
| 2019 | 32,933 | 8,331 | 41,264 |
| 2020 | 27,892 | 4,851 | 32,743 |
| 2021 | 30,277 | 5,973 | 36,250 |
| 2022 | 32,056 | 6,736 | 38,792 |
| 2023 | 32,070 | 4,759 | 36,829 |
(Unit tons)
- Market-based (Non-Fossil Fuel Certificate applied)
- In line with the GHG Protocol’s Scope 2 Guidance, we take the market-based approach (which reflects supplier-specific emissions factors associated with our energy purchases).
- Differences due to changes in emission factors are calculated using the average emission factors of all power sources in 2000 (0.378kg-CO2/kwh).
CO2 Emissions (Initiatives to Reduce CO2 under the SBTs)
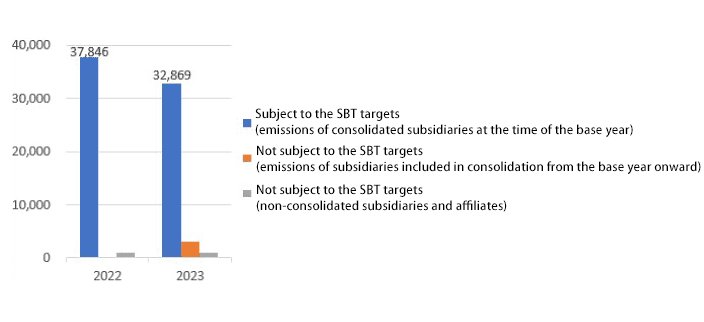
| Subject to the SBT targets (emissions of consolidated subsidiaries at the time of the base year) | Not subject to the SBT targets (emissions of subsidiaries included in consolidation from the base year onward) | Not subject to the SBT targets (non-consolidated subsidiaries and affiliates) | Total | |
|---|---|---|---|---|
| 2022 | 37,846 | - | 946 | 38,792 |
| 2023 | 32,869 | 2,976 | 984 | 36,829 |
(Unit tons)
CO2 emission by source
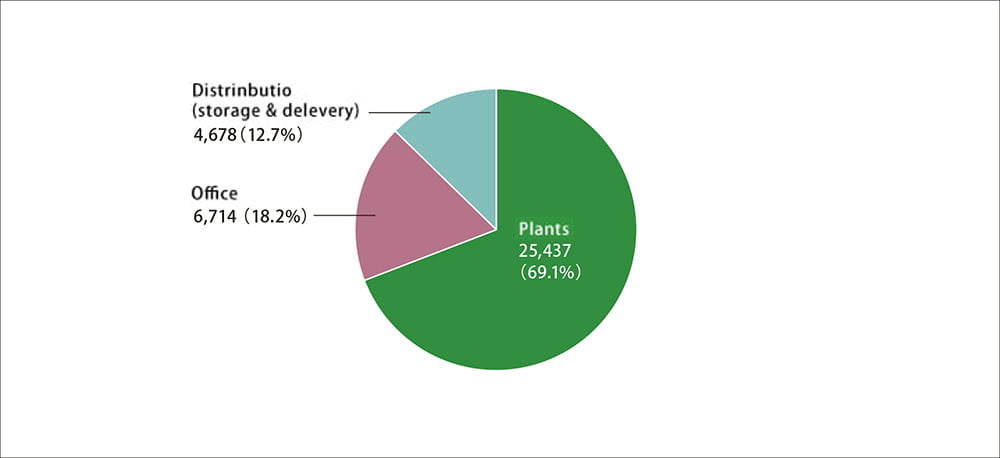
| CO2 emissions | Composition ratio | |
|---|---|---|
| Plants | 25,437 | 69.1% |
| Offices | 6,714 | 18.2% |
| Distribution (storage, deliveries) | 4,678 | 12.7% |
| Total | 36,829 | 100% |
(Unit tons)
Market-based (Non-Fossil Fuel Certificate applied)
CO2 emission by source
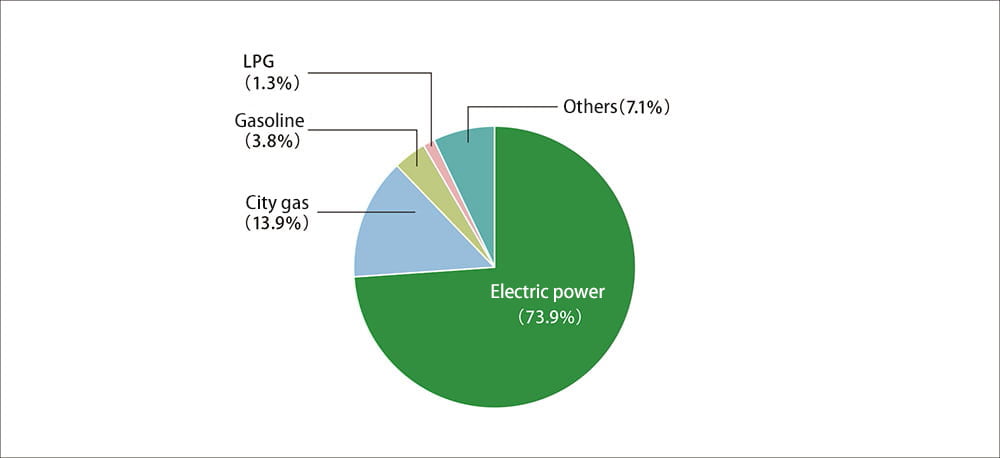
| CO2 emissions | Composition ratio | |
|---|---|---|
| Electricity | 27,223 | 73.9% |
| City gas | 5,103 | 13.9% |
| Gasoline | 1,409 | 3.8% |
| LPG | 462 | 1.3% |
| Other | 2,631 | 7.1% |
| Total | 36,828 | 100% |
(Unit tons)
Market-based (Non-Fossil Fuels Certificate applied)
CO2 emission by country
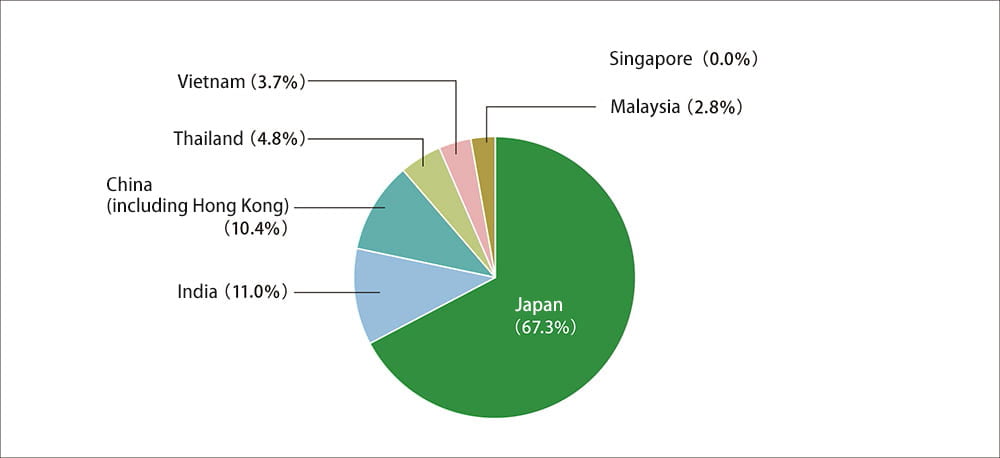
| CO2 emissions | Composition ratio | |
|---|---|---|
| Japan | 27,581 | 67.3% |
| India | 4,525 | 11.0% |
| China (including Hong Kong) | 4,248 | 10.4% |
| Thailand | 1,984 | 4.8% |
| Vietnam | 1,518 | 3.7% |
| Malaysia | 1,141 | 2.8% |
| Singapore | 10 | 0.0% |
| Total | 41,007 | 100.0% |
(Unit tons)
Location-based
Greenhouse gases emitted by the supply chain
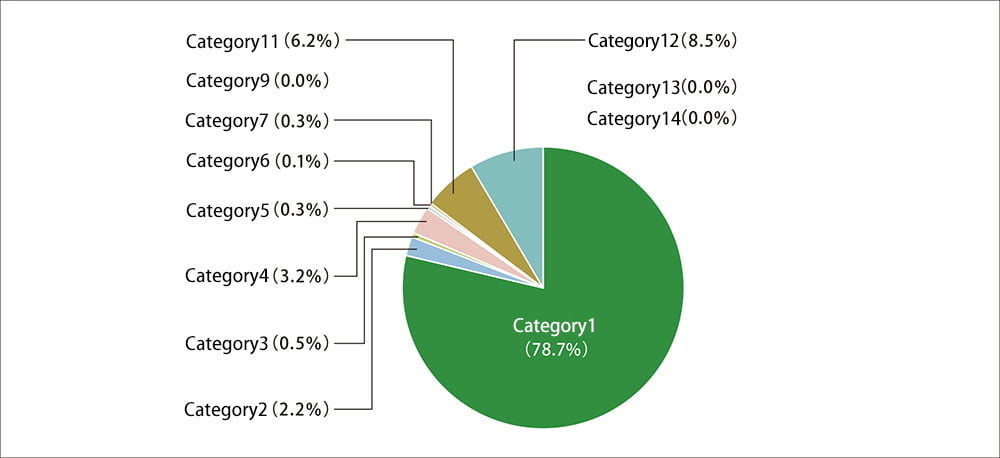
| Category | Applicable/ Not applicable | Reason for Non-applicability | Scope 3 Emissions | As Percentage of Total | As Percentage of Total Emissions | |
|---|---|---|---|---|---|---|
| Category 1 | Purchased products / services | Applicable | - | 1,011,674 | 78.7% | 76.5% |
| Category 2 | Capital goods | Applicable | - | 28,701 | 2.2% | 2.2% |
| Category 3 | Fuel not included in Scope 1 or 2 and energy-related activities | Applicable | - | 6,340 | 0.5% | 0.5% |
| Category 4 | Shipping and delivery (upstream) | Applicable | - | 41,293 | 3.2% | 3.1% |
| Category 5 | Waste materials generated by businesses | Applicable | - | 4,208 | 0.3% | 0.3% |
| Category 6 | Business trips | Applicable | - | 1,242 | 0.1% | 0.1% |
| Category 7 | Commuting by workers | Applicable | - | 3,272 | 0.3% | 0.2% |
| Category 8 | Leased assets (upstream) | Not applicable | Included in Scope 1 / 2 | - | 0.0% | 0.0% |
| Category 9 | Shipping and delivery (downstream) | Applicable | - | 5 | 0.0% | 0.0% |
| Category 10 | Processing of sold products | Not applicable | KOKUYO is a manufacturer of completed products and does not deal with intermediate products | - | 0.0% | 0.0% |
| Category 11 | Use of sold products | Applicable | - | 79,250 | 6.2% | 6.0% |
| Category 12 | Discarding of sold products | Applicable | - | 109,111 | 8.5% | 8.2% |
| Category 13 | Leased assets (downstream) | Applicable | - | 284 | 0.0% | 0.0% |
| Category 14 | Franchises | Applicable | - | 382 | 0.0% | 0.0% |
| Category 15 | Investments | Not applicable | No investments | - | 0.0% | 0.0% |
| Total | - | - | - | 1,285,762 | - | - |
Greenhouse gases emitted by the supply chain
(by scope) (Tons of CO2)
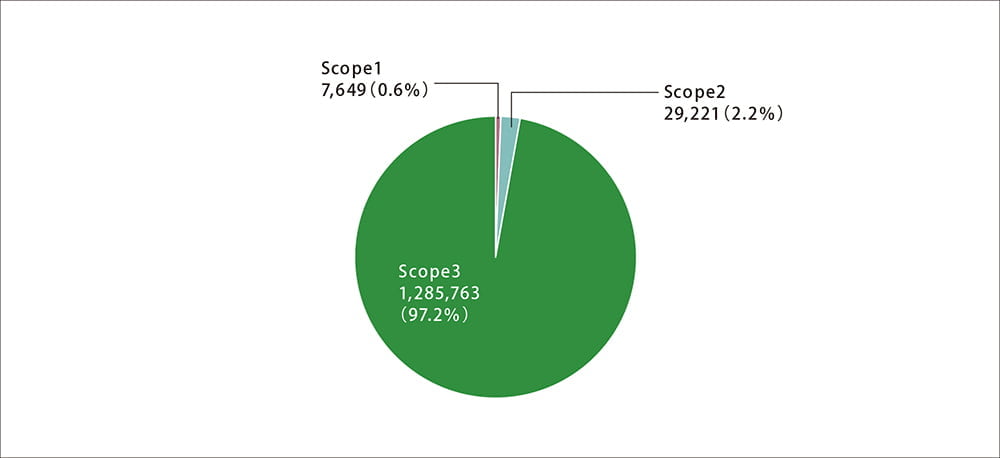
| 2023 | Emissions by scope | Ratio |
|---|---|---|
| Scope 1 | 7,649 | 0.6% |
| Scope 2 | 29,221 | 2.2% |
| Scope 3 | 1,285,763 | 97.2% |
| Total | 1,322,633 | - |
(Unit Tons of CO2)
Greenhouse gases emitted by the supply chain
(for Scope 3)
Resource Saving and Recycling
Waste Materials: Recycling and Final Disposal Amounts
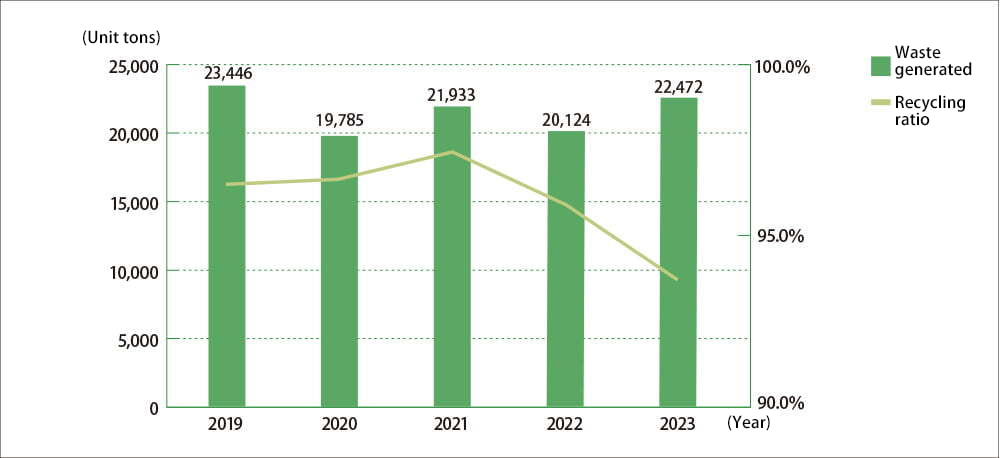
| Waste generated | Recycling amount | Recycling ratio | |
|---|---|---|---|
| 2019 | 23,446 | 22,591 | 96.4% |
| 2020 | 19,785 | 19,107 | 96.6% |
| 2021 | 21,933 | 21,357 | 97.4% |
| 2022 | 20,124 | 19,300 | 95.9% |
| 2023 | 22,472 | 21,074 | 93.8% |
(Unit tons)
Waste Materials by Activity
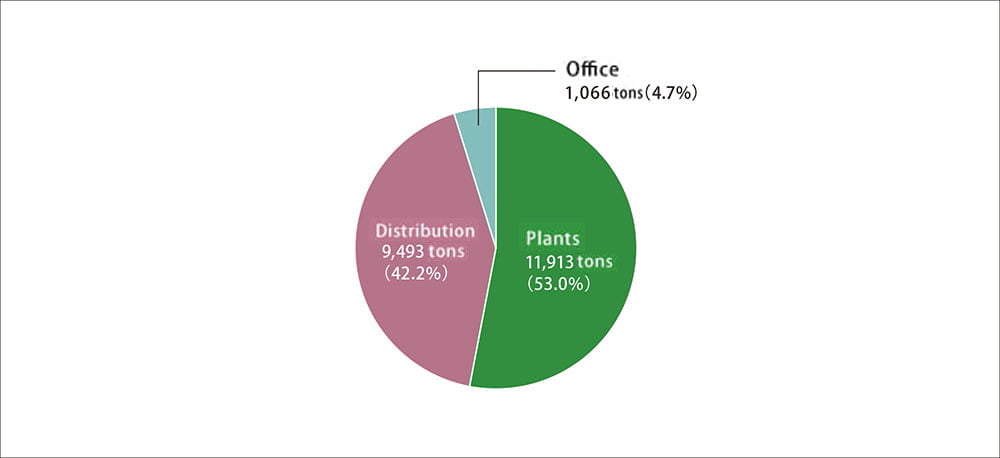
| Waste generated | Composition ratio | |
|---|---|---|
| Plants | 11,913 | 53.0% |
| Distribution | 9,493 | 42.2% |
| Offices | 1,066 | 4.7% |
| Total | 22,472 | 99.9% |
(Unit tons)
Waste material types (Recycling rate in brackets)
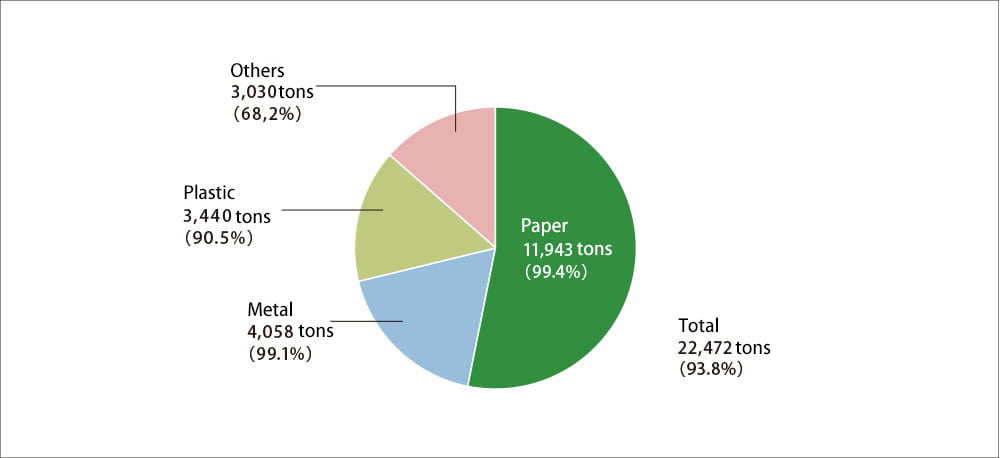
| Waste generated | Recycling amount | Recycling ratio | |
|---|---|---|---|
| Paper | 11,943 | 11,876 | 99.4% |
| Metals | 4,058 | 4,021 | 99.1% |
| Plastic | 3,440 | 3,113 | 90.5% |
| Other | 3,030 | 2,063 | 68.2% |
| Total | 22,471 | 21,073 | 93.8% |
(Unit tons)
Plastic waste generation (in Japan)
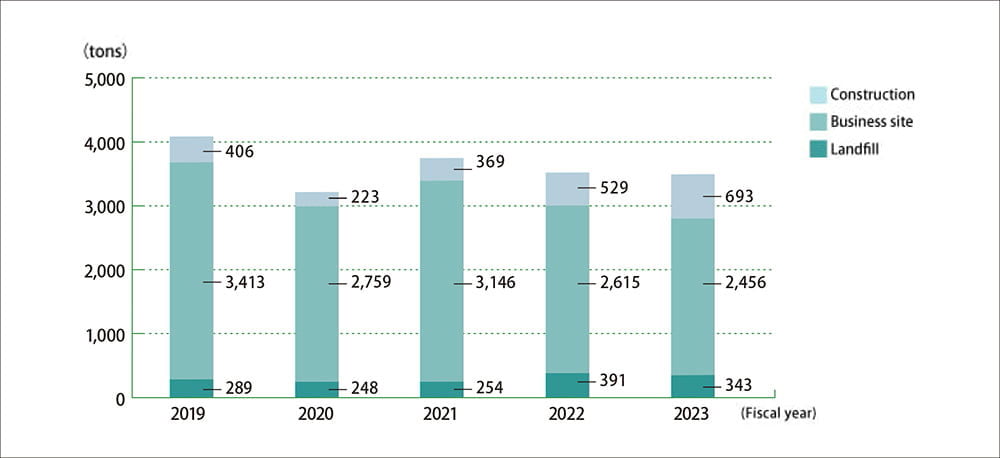
| Year | Final disposal amount | Business offices | Construction sites | Total |
|---|---|---|---|---|
| 2019 | 289 | 3,413 | 406 | 4,108 |
| 2020 | 248 | 2,759 | 223 | 3,229 |
| 2021 | 254 | 3,146 | 369 | 3,769 |
| 2022 | 391 | 2,615 | 529 | 3,535 |
| 2023 | 343 | 2,456 | 693 | 3,492 |
(Unit tons)
Emissions by Country
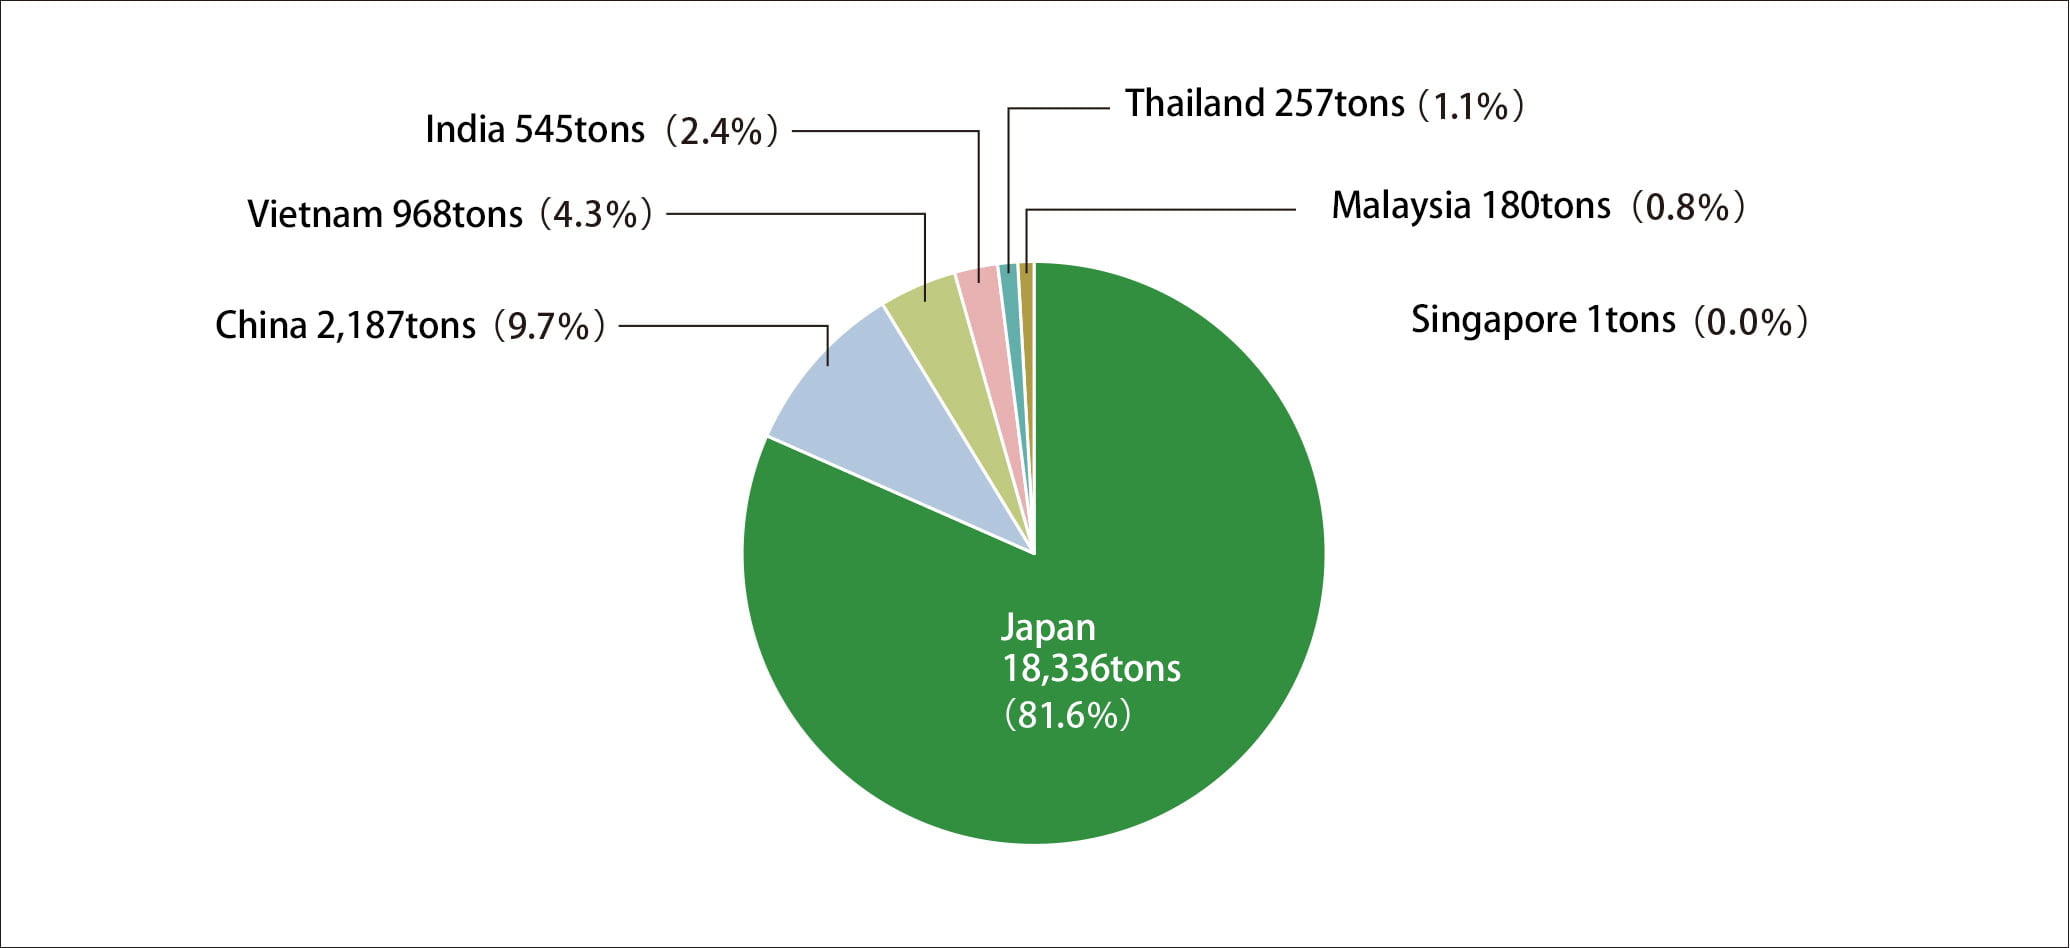
| Waste generated | Waste generated composition ratio | |
|---|---|---|
| Japan | 18,336 | 81.6% |
| China | 2,187 | 9.7% |
| Vietnam | 968 | 4.3% |
| India | 545 | 2.4% |
| Thailand | 257 | 1.1% |
| Malaysia | 180 | 0.8% |
| Singapore | 1 | 0.0% |
| Total | 22,472 | 100.0% |
Hazardous Waste Generation
(Unit tons)
- KOKUYO Group defines and manages specially controlled industrial waste (as defined in Act on Waste Management and Public Cleansin) as hazardous waste.
- KOKUYO Group covers KOKUYO Co., Ltd. and 20 consolidated subsidiaries and 10 affiliates.
Water Resources
Water used, water recycled, water discharged
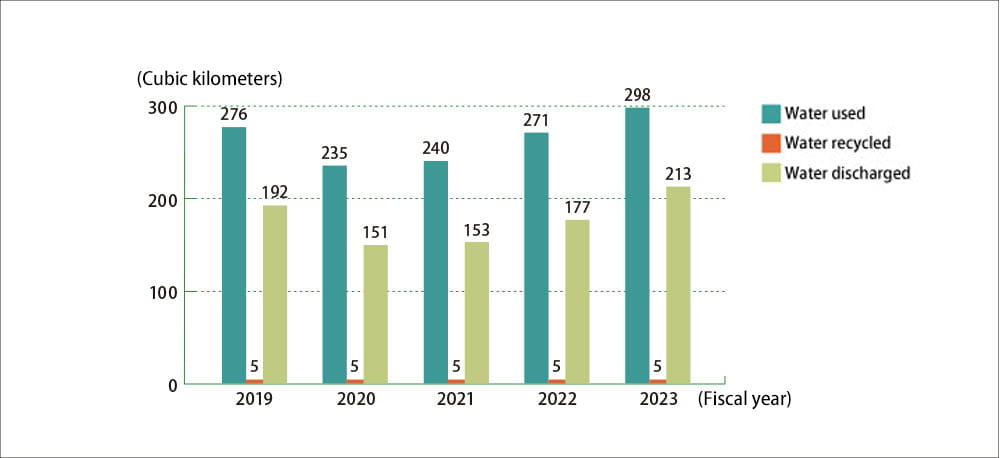
| Water used | Water recycled | Water discharged | |
|---|---|---|---|
| 2019 | 276 | 5 | 192 |
| 2020 | 235 | 5 | 151 |
| 2021 | 240 | 5 | 153 |
| 2022 | 271 | 5 | 177 |
| 2023 | 298 | 5 | 213 |
(Unit 1,000㎥)
- Water recycled: Water recycled in factories
- Water discharged: Wastewater discharged into public water bodies or sewers
- The volume of water used and discharged increased in 2022 because the Indian subsidiary was included in that year.
Water usage by location
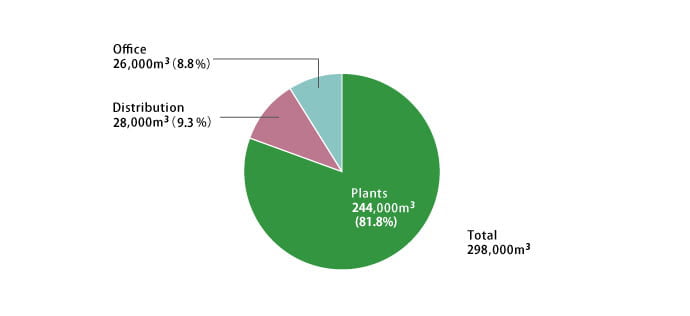
| Water usage | Composition ratio | |
|---|---|---|
| Plants | 244 | 81.8% |
| Distribution | 28 | 9.3% |
| Offices | 26 | 8.8% |
| Total | 298 | 99.9% |
(Unit 1,000㎥)
Water usage by country
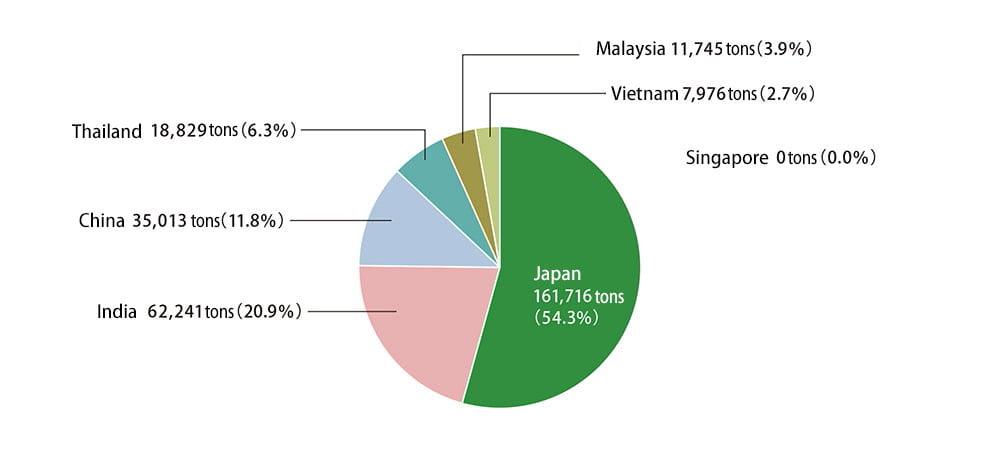
| Water usage | Water usage composition ratio | |
|---|---|---|
| Japan | 161,716 | 54.3% |
| India | 62,241 | 20.9% |
| China | 35,013 | 11.8% |
| Thailand | 18,829 | 6.3% |
| Malaysia | 11,745 | 3.9% |
| Vietnam | 7,976 | 2.7% |
| Singapore | 97 | 0.0% |
| Total | 297,617 | 100.0% |
Hazardous Waste Generation
| 2021 | 2022 | 2023 | |
|---|---|---|---|
| Public water areas | 42 | 40 | 40 |
| Grandwater | 111 | 138 | 173 |
| Total | 153 | 178 | 213 |
(Unit 1,000㎥)
Chemical Substances Subject to PRTR Law
| PRTR Management No. | Chemical name | Vol. handled (kg) |
Vol. Released | Vol. Treated (kg) |
Vol. Consumed (kg) |
||||
|---|---|---|---|---|---|---|---|---|---|
| Vol. Released into Air (kg) |
Vol. Released into Public Bodies of Water (kg) |
Vol. Released into Sewers (kg) |
Vol. Sent to Landfill (kg) |
Sub-total (kg) |
|||||
| 1 | Zinc compounds (water-soluble) | 127.3 | 0.0 | 0.0 | 0.0 | 0.0 | 0.0 | 127.3 | 0.0 |
| 20 | 2-aminoethanol | 249.2 | 0.0 | 0.0 | 0.0 | 0.0 | 0.0 | 249.2 | 0.0 |
| 30 | Linear Alkyl Benzene Sulfonic Acid and its salts (LAS) | 15.0 | 0.0 | 0.0 | 0.0 | 15.0 | 15.0 | 0.0 | 0.0 |
| 53 | Ethylbenzene | 21.3 | 13.0 | 0.0 | 0.1 | 0.1 | 13.2 | 0.0 | 8.1 |
| 80 | Xylene | 22.8 | 14.0 | 0.0 | 0.1 | 0.1 | 14.1 | 0.0 | 8.6 |
| 82 | Silver and its water-soluble compounds | 1.0 | 0.0 | 0.0 | 0.0 | 0.0 | 0.0 | 1.0 | 0.0 |
| 83 | Cumene | 6.1 | 6.0 | 0.0 | 0.1 | 0.0 | 6.1 | 0.0 | 0.0 |
| 125 | Chlorobenzene | 11.0 | 10.9 | 0.0 | 0.1 | 0.0 | 11.0 | 0.0 | 0.0 |
| 127 | Chloroform | 5.7 | 5.6 | 0.0 | 0.1 | 0.0 | 5.7 | 0.0 | 0.0 |
| 134 | Vinyl acetate | 3.1 | 1.4 | 0.0 | 0.0 | 0.0 | 1.4 | 0.0 | 1.6 |
| 232 | N,N-dimethylformamide | 0.0 | 0.0 | 0.0 | 0.0 | 0.0 | 0.0 | 0.0 | 0.0 |
| 298 | Tolylene diisocyanate | 0.6 | 0.6 | 0.0 | 0.0 | 0.0 | 0.6 | 0.0 | 0.0 |
| 300 | Toluene | 36.0 | 35.6 | 0.0 | 0.4 | 0.0 | 36.0 | 0.0 | 0.0 |
| 302 | Naphthalene | 20.4 | 20.2 | 0.0 | 0.2 | 0.0 | 20.4 | 0.0 | 0.0 |
| 309 | Nickel compounds | 10.0 | 0.0 | 0.0 | 0.0 | 0.0 | 0.0 | 10.0 | 0.0 |
| 321 | Vanadium compounds | 2.0 | 0.0 | 0.0 | 0.0 | 0.0 | 0.0 | 0.0 | 2.0 |
| 354 | Di-n-butyl phthalate | 13.4 | 0.0 | 0.0 | 0.0 | 0.0 | 0.0 | 0.0 | 13.4 |
| 392 | N-hexane | 30.8 | 30.8 | 0.0 | 0.0 | 0.0 | 30.8 | 0.0 | 0.0 |
| 407 | Poly(oxyethylene) alkyl ether | 436.3 | 0.0 | 0.0 | 15.5 | 175.8 | 191.3 | 0.7 | 244.3 |
| 410 | Poly(oxyethylene) nonylphenyl ether | 6.9 | 0.0 | 0.0 | 0.0 | 0.2 | 0.2 | 0.0 | 6.7 |
| 412 | Manganese and its compounds | 18.2 | 0.8 | 0.0 | 0.0 | 6.5 | 7.3 | 0.0 | 10.9 |
| 448 | Methylenebis(4,1-cyclohexylene) diisocyanate | 309.7 | 0.0 | 0.0 | 0.0 | 0.0 | 0.0 | 0.0 | 309.7 |
| 453 | Molybdenum and its compounds | 275.4 | 0.0 | 0.0 | 0.0 | 0.0 | 0.0 | 0.0 | 275.4 |
| 565 | Polyacrylic acid | 160.0 | 0.0 | 0.0 | 154.8 | 5.2 | 160.0 | 0.0 | 0.0 |
| 579 | Alpha-alkyl-omega-hydroxy poly [oxyethane-1,2-diyl/oxy(methylethane-1,2-diyl)] (Limited to mixtures for which the alkali group structure is branched and that alkyl group has from 9 to 11 carbon atoms (limited to mixtures for which that alkyl group has 10 carbon atoms as the main component) | 38.0 | 0.0 | 0.0 | 0.0 | 0.0 | 0.0 | 38.0 | 0.0 |
| 585 | Alpha-(isocyanatobenzyl)-omega-(isocyanatophenyl)poly[(isocyanatophenylene)methylene] | 33.2 | 33.2 | 0.0 | 0.0 | 0.0 | 33.2 | 0.0 | 0.0 |
| 594 | Ethylene glycol monobutyl ether | 12,301.6 | 11.9 | 0.0 | 0.0 | 0.4 | 12.3 | 12,289.3 | 0.0 |
| 595 | Ethylenediaminetetraacetic acid and its potassium and sodium salts | 7.6 | 0.0 | 0.0 | 0.0 | 7.2 | 7.2 | 0.5 | 0.0 |
| 626 | Diethanolamine | 293.3 | 0.0 | 0.0 | 0.0 | 9.7 | 9.7 | 0.0 | 283.7 |
| 627 | Diethylene glycol monobutyl ether | 5,513.8 | 88.2 | 0.0 | 0.0 | 3.0 | 91.2 | 5,422.6 | 0.0 |
| 629 | Cyclohexane | 7,179.1 | 7,179.1 | 0.0 | 0.0 | 0.0 | 7,179.1 | 0.0 | 0.0 |
| 653 | Dimethyl (1-phenylethyl) benzene | 1.6 | 0.0 | 0.0 | 0.0 | 1.6 | 1.6 | 0.0 | 0.0 |
| 661 | 1,2-dimethoxyethane | 9.3 | 9.0 | 0.0 | 0.0 | 0.3 | 9.3 | 0.0 | 0.0 |
| 691 | Trimethylbenzene | 19.9 | 19.7 | 0.0 | 0.2 | 0.0 | 19.9 | 0.0 | 0.0 |
| 708 | (1-Hydroxyethane-1,1-diyl)diphosphonic acid and its potassium and sodium salts | 22.3 | 22.3 | 0.0 | 0.0 | 0.0 | 22.3 | 0.0 | 0.0 |
| 731 | Heptane | 2,720.5 | 2,720.5 | 0.0 | 0.0 | 0.0 | 2,720.5 | 0.0 | 0.0 |
| 746 | N-methyl-2-pyrrolidone | 0.0 | 0.0 | 0.0 | 0.0 | 0.0 | 0.0 | 0.0 | 0.0 |
| 753 | Sulfide (2,4,4-trimethylpentene) | 0.1 | 0.1 | 0.0 | 0.0 | 0.0 | 0.1 | 0.0 | 0.0 |
| Total | 29,922.5 | 10,222.9 | 0.0 | 171.6 | 255.1 | 10,619.5 | 18,138.6 | 1,164.4 | |
- We made the calculations for the specific class 1 designated chemical substances and the class 1 designated chemical substances under the PRTR Law which was revised in 2021 (came into effect on April 1, 2023). Therefore, the calculation period for the actual values for 2023 of the applicable substances is from April 1 to December 31, 2023.
- The volume of PRTR Law Class I Designated Chemical Substances that were used, handled, released, transferred, disposed, recycled, and consumed by the business establishments (in Japan) subject to notification under the PRTR Law.
- For the calculation methods, see the Ministry of the Environment/Ministry of Economy, Trade and Industry’s PRTR Release Estimation Methods Manual, version 5.0 (March 2023).
- “Volume treated” refers to those PRTR designated substances that were treated on site by incineration, neutralization, breaking down, reactive process, etc.
- “Volume consumed” refers to the volume of substances that were removed from the site by the removal of the products containing or accompanying them or that were modified for disposal by means of chemical reaction with other substances.
Environmental Load Material Flow
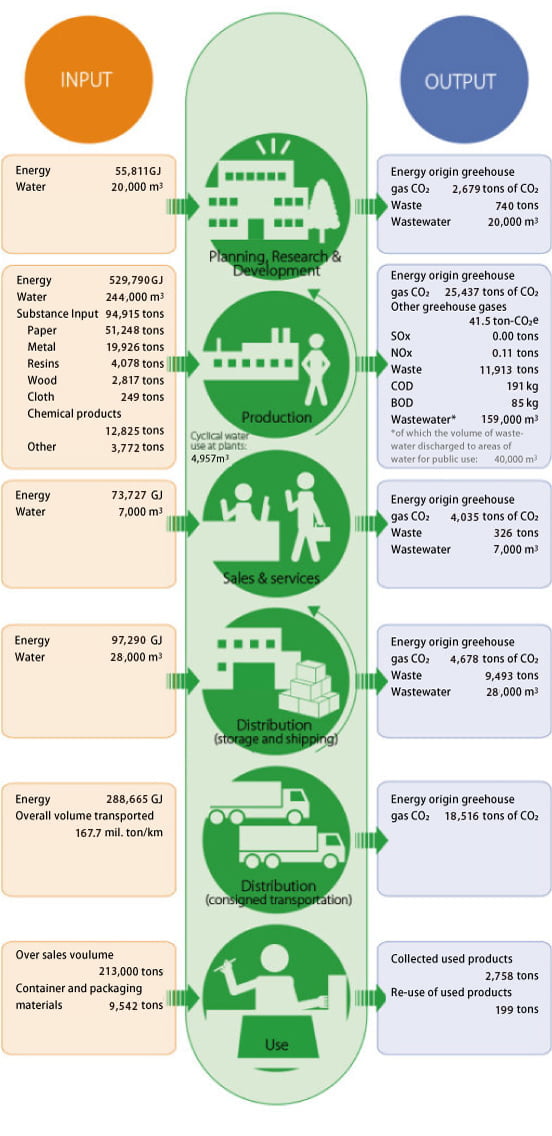
| Planning, R&D | Manufacturing | Sales, services | Distribution (storage, deliveries) | Logistics (contracted goods transportation) | Total | ||
|---|---|---|---|---|---|---|---|
| Inputs | Energy (GJ) | 55,811 | 529,790 | 73,727 | 97,290 | 288,665 | |
| Water (km3) | 20 | 244 | 7 | 28 | |||
| Total volume transported (Mt) | 167.7 | ||||||
| Substance inputs (t) | 94,915 | ||||||
| Paper (t) | 51,248 | ||||||
| Metals (t) | 19,926 | ||||||
| Resins (t) | 4,078 | ||||||
| Wood (t) | 2,817 | ||||||
| Cloth (t) | 249 | ||||||
| Chemical products (t) | 12,825 | ||||||
| Other (t) | 3,772 | ||||||
| Total volume sold (kt × 10) | 21.3 | ||||||
| Packaging (t) | 9,542 | ||||||
| Recycling | Water recycled in factories (m3) | 5,120 | |||||
| Outputs | CO2 emissions from electrical power (tCO2) | 2,679 | 25,437 | 4,035 | 4,678 | 18,516 | |
| GHG emissions from sources other than electrical power (tCO2e) | 41.5 | ||||||
| SOx (t) | - | ||||||
| NOx (t) | 0.11 | ||||||
| Waste (t) | 740 | 11,913 | 326 | 9,493 | |||
| Wastewater (km3) | 20 | 159 | 7 | 28 | |||
| Discharges to public water bodies (km3) | 40 | ||||||
| COD (kg) | 191 | ||||||
| BOD (kg) | 85 | ||||||
| Used products collected (t) | 2,758 | ||||||
| Used products reused (t) | 199 | ||||||
Input items
| Indicator | Unit | Calculation method |
|---|---|---|
| Volume of energy used | GJ | Power, gas (city gas, LPG, natural gas), oil (gasoline, light oil, kerosene, fuel oil A), heat (hot water, cold water) The power unit calorific values are the daytime and nighttime power values stated in the Enforcement Regulations of the Act on the Rational Use of Energy (effective from April 1, 2008). The unit calorific values of gas, oil, and heat are those values presented in the Greenhouse Gas Emission Calculation and Reporting Manual, Ver. 4.9 (Apr 2023, Ministry of the Environment, Ministry of Economy, Trade and Industry). |
| Water | km3 | Tap water, water for industrial use |
| Substance Input | t | The volume of raw materials used to manufacture products in the plants of the KOKUYO Group |
| Overall Sales Volume | kt × 10 | Data from furniture and stationery products |
| Container and Packaging Materials | t | The volume of packaging materials used to package products |
Output Items
| Indicator | Unit | Calculation method |
|---|---|---|
| CO2 Emissions from Energy Use | t-CO2 | CO2 emissions from the use of electricity, gas, oil, and heat (see Global Warming Preventive Measures) Coefficients based on the Act on Promotion of Global Warming Countermeasures (adjusted emission coefficients based on the actual values in fiscal 2021 and 2022 for each power company) were used to calculate the CO2 emissions factors for power consumption in Japan. For power consumption overseas, we use the local emissions factors listed in IEA Emissions Factors 2023. Values presented in the Greenhouse Gas Emission Calculation and Reporting Manual, Ver. 4.9 (Apr 2023) and Ver. 5.0 (Feb 2024) (Ministry of the Environment, Ministry of Economy, Trade and Industry) were used to calculate CO2 emissions factors for gas, oil, and heat. The ton/kilo method and the fuel consumption method were both used to calculate the distribution (consigned transportation) CO2 emissions. |
| Other Greenhouse Gases | t-CO2e | Emissions of greenhouse gases (CO2, CH4, N2O) related to production activities, (in Japan), but excluding such emissions from energy sources, have been converted to a CO2 basis. Emission coefficient values were taken from the Ministry of the Environment and the Ministry of Economy, Trade and Industry's Greenhouse Gas Emission Calculation and Reporting Manual, Ver. 5.0 (Dec 2024). |
| SOx, NOx | t | Emissions from smoke- and soot-producing facilities at manufacturing plants (in Japan) |
| Waste | t | The volume of discharged waste (emissions) is the total amount of waste and valuable substances discharged from business establishments. The recycle volume is the total of the volume of discharged waste (emissions) that has been recycled through material or thermal recycling, and the volume of valuable substances. The final waste volume is the combined total of the recycling residue and the volume of waste directly disposed of in landfills, out of the total volume of discharged waste (solid waste) (see Resource Saving and Recycling). If industrial waste has been calculated by cubic measurement, conversion factors (reference) for converting cubic measurements of industrial waste into weights as stated in a notice released by the Ministry of the Environment (December 27, 2006; Env. Ind. Waste Issue No. 061227006) were used. |
| Wastewater | km3 | Wastewater discharged to areas of water for public use and into the sewage system |
| COD, BOD | kg | Of plants in Japan, the volume of effluent discharged to areas of water for public use by plants with a legal obligation to measure water quality |
Other items
| Indicator | Unit | Calculation method |
|---|---|---|
| Overall Transportation Volume | tkm | The total of the following outsourced transportation volumes: total domestic transportation in Japan including the transportation of furniture products, store fixtures, stationery products, transportation of catalog sales by Kaunet, and transportation of Actus products; and transportation of products between overseas sites and within Malaysia. |
| Cyclical Water Use at Plants | m3 | The volume of water used in a cyclical way (i.e. recycled) on business premises |
| Cyclical Resource Use on Sitest | t | The volume of recycled resources, such as packaging materials, on the business premises of KOKUYO Logitem and KOKUYO Supply Distribution. |
| Collected Used Products | t | The volume of used products collected from customers by KOKUYO Logitem. |
| Re-use of Used Products | t | The volume of re-used products from the used products collected from customers by KOKUYO Logitem. |
Environmental Accounting
Environmental Accounting
(Unit: Multiple of 10 thousand yen)
| Item | Environment-related Investments | Costs | Effects | Total | ||||||||
|---|---|---|---|---|---|---|---|---|---|---|---|---|
| 2021 | 2022 | 2023 | 2021 | 2022 | 2023 | 2021 | 2022 | 2023 | 2021 | 2022 | 2023 | |
| Pollution prevention | 690 | 0 | 0 | 1,532 | 1,778 | 2,550 | 0 | 0 | 0 | 1,532 | 1,778 | 2,550 |
| Global warming prevention | 10,785 | 7,491 | 1,124 | 8,200 | 2,481 | 4,306 | ▲2,160 | ▲1,603 | ▲1,400 | 6,040 | 878 | 2,906 |
| Resource saving and recycling | 0 | 0 | 0 | 54,265 | 50,736 | 45,842 | ▲24,564 | ▲26,213 | ▲26,050 | 29,701 | 24,523 | 19,792 |
| Procurement and provision of eco-friendly products | 0 | 0 | 0 | 3,583 | 4,980 | 3,434 | 0 | 0 | 0 | 3,583 | 4,980 | 3,434 |
| Survey and research into environmental technology | 0 | 0 | 0 | 160 | 148 | 317 | 0 | 0 | 0 | 160 | 148 | 317 |
| Environmental communication | 0 | 0 | 0 | 1,623 | 3,547 | 3,539 | 0 | 0 | 0 | 1,623 | 3,547 | 3,539 |
| Setting up management structures | 0 | 0 | 0 | 6,369 | 9,244 | 11,361 | 0 | 0 | 0 | 6,369 | 9,244 | 11,361 |
| Environmental damage response | 0 | 0 | 0 | 0 | 0 | 0 | 0 | 0 | 0 | 0 | 0 | 0 |
| Total | 11,475 | 7,491 | 1,124 | 75,732 | 72,914 | 71,347 | ▲26,724 | ▲27,816 | ▲27,450 | 49,008 | 45,098 | 43,899 |
Breakdown of economic effects
| Item | Content of countermeasures | 2021 | 2022 | 2023 |
|---|---|---|---|---|
| Global warming prevention | Effects of introducing energy-saving facilities | ▲1,124 | ▲633 | ▲324 |
| Effects of solar power generation | ▲978 | ▲936 | ▲976 | |
| Effects of improving operations | ▲58 | ▲34 | ▲101 | |
| Resource saving and recycling | Proceeds from garbage sorting and recycling | ▲24,561 | ▲26,213 | ▲26,050 |
| Waste Reduction | ▲2 | 0 | 0 | |
| Cost reductions achieved through the promotion of recycling | 0 | 0 | 0 | |
| Total | ▲26,723 | ▲27,816 | ▲27,451 |
Sites with ISO 14001 Certification
Seventy-three sites, or 38% of the total 192 sites have received ISO 14001 certification.
| No. | Company Name | Site Name |
|---|---|---|
| 1 | KOKUYO | Head Office (including XT and WS) |
| 2 | Tokyo Shinagawa Office | |
| 3 | Tokyo Shinagawa SST Office | |
| 4 | Tokyo Kasumigaseki Office | |
| 5 | Nagoya Office | |
| 6 | Osaka Umeda Office | |
| 7 | Mie Factory | |
| 8 | Shibayama Factory | |
| 9 | KOKUYO K Heart | Head Office |
| 10 | KOKUYO MVP | Tottori Factory |
| 11 | Aoya Factory | |
| 12 | KOKUYO Product Shiga | Head Office |
| 13 | KOKUYO Logitem | Head Office |
| 14 | Sapporo Distribution Center | |
| 15 | Sendai Distribution Center | |
| 16 | Gunma Distribution Center | |
| 17 | Central Japan Delivery and Distribution Center | |
| 18 | Central Japan Delivery Center | |
| 19 | Shin Chiba Distribution Center | |
| 20 | Shiga Distribution Center | |
| 21 | Mie Distribution Center | |
| 22 | Ina Distribution Center | |
| 23 | Chubu Delivery and Distribution Center | |
| 24 | Toyama Distribution Center | |
| 25 | Fujiwara Distribution Center | |
| 26 | Komono Distribution Center | |
| 27 | Kansai Delivery and Distribution Center | |
| 28 | Okayama Distribution Center | |
| 29 | Kyushu Distribution Center | |
| 30 | KOKUYO Supply Logistics | Head Office |
| 31 | Sapporo Distribution Center | |
| 32 | Ibaraki Distribution Center | |
| 33 | Metropolitan Area Integrated Distribution Center | |
| 34 | Chubu Integrated Distribution Center | |
| 35 | Shiga National Distribution Center | |
| 36 | Kinki Integrated Distribution Center | |
| 37 | Osaka Nanko Distribution Center | |
| 38 | Kyushu Integrated Distribution Center | |
| 39 | Fukuoka Distribution Center |
| No. | Company Name | Site Name |
|---|---|---|
| 40 | Kaunet | Head Office |
| 41 | Tokyo Shinagawa Office | |
| 42 | KOKUYO Marketing | Head Office |
| 43 | Tachikawa Office | |
| 44 | Chiba Office | |
| 45 | Saitama Office | |
| 46 | Yokohama Office | |
| 47 | Nagano Office | |
| 48 | Matsumoto Office | |
| 49 | Nagoya Office | |
| 50 | Shizuoka Office | |
| 51 | Umeda Office | |
| 52 | Kyoto Office | |
| 53 | Kobe Office | |
| 54 | Wakayama Office | |
| 55 | Hiroshima Office | |
| 56 | Yamaguchi Office | |
| 57 | Matsue Office | |
| 58 | Fukuoka Office | |
| 59 | Nagasaki Office | |
| 60 | Miyazaki Office | |
| 61 | Kagoshima Office | |
| 62 | Kumamoto Office | |
| 63 | Oita Office | |
| 64 | Okinawa Office | |
| 65 | KOKUYO (Malaysia) | Head Office |
| 66 | KOKUYO-IK Thailand | Head Office |
| 67 | KOKUYO Camlin | Patalganga Plant |
| 68 | Tarapur Plant | |
| 69 | Samba Plant | |
| 70 | KOKUYO Commere (Shanghai) | Head Office |
| 71 | Beijing Office | |
| 72 | Shenzhen Office | |
| 73 | LAMEX Dongguan Plant |